Visitors

Thursday, November 9, 2017

Western Canada's ice age melt offers preview for modern climate change

Study adds to evidence that first Americans didn't pass through B.C. interior

By Emily Chung, CBC News Posted: Nov 09, 2017 2:00 PM ET Last Updated: Nov 09, 2017 2:00 PM ET
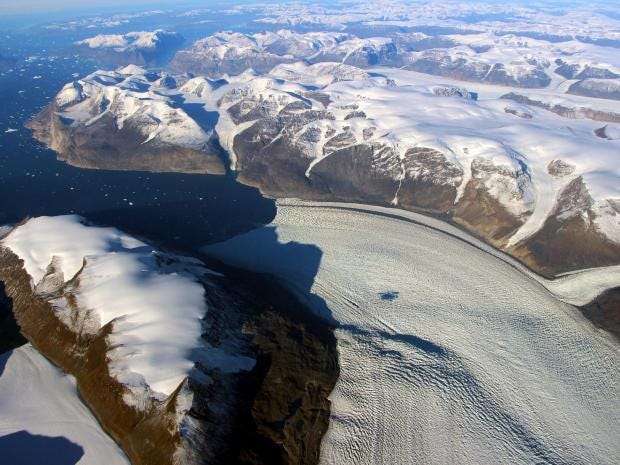
This 2009 photo released by Extreme Ice Survey shows Birthday Canyon in Greenland during
the filming of Chasing Ice.' New findings about the melting of a western Canadian ice sheet at
the end of the ice age may offer a preview of what's in store for Greenland's ice sheet as it melts
from human-caused climate change. (James Balog/Extreme Ice Survey/Associated Press)

Emily Chung covers science and technology for CBC News. She has previously worked as a
digital journalist for CBC Ottawa and as an occasional producer at CBC's Quirks & Quarks.
She has a Ph.D. in chemistry.

The ice sheet that covered much of Western Canada at the end of the last ice age melted earlier
and more quickly than scientists thought, a new study suggests. The findings bolster evidence
that the melting of the Cordilleran Ice Sheet could have boosted sea levels by up to three metres.

'If you want to understand future and present day, then it's often good to look at the past.'
- Brian Menounos, UNBC

The new research, which uncovers great detail about how the Cordilleran Ice Sheet melted
and fell to pieces, could also provide a preview of what to expect as Greenland melts due to
human-caused climate change.

And it adds to evidence that the first humans in North America did not travel through central
B.C. as they moved south from the Bering Peninsula around 14,000 years ago.

Brian Menounos, the Canadian researcher who led the study, spent 10 years helicoptering into
remote mountaintops in B.C., the Yukon and the Northwest Territories with his team, then
hammering, chiselling, and sawing rectangular rock "brownies" from huge boulders to take
back to the lab. The boulders were located in moraines – huge piles of rock and debris left
behind by melting glaciers that scientists use to understand past climate change.

"If you want to understand future and present day, then it's often good to look at the past,"
said Menounos, a geography professor at the University of Northern British Columbia who
holds a Canada Research Chair in glacier change.

Brian Menounos and his team hammered, chiselled and sawed 76 rectangular rock 'brownies'
(with M&Ms and Lego stormtrooper for scale) from huge boulders on mountaintops to take
back to the lab for analysis. (Brian Menounos/UNBC)


Understanding how the Cordilleran ice sheet melted is particularly useful because it's very
similar to the present-day ice sheet that's melting in Greenland. Both contain similar amounts
of ice, have similar mountainous topography underneath, and feed meltwater directly into the
ocean, Menounos and his colleagues note in a new paper published today in the journal Science.

That means the Cordilleran ice sheet melt could show us what impacts we can expect in the
future as the Greenland ice sheet warms and liquefies.

Traditionally, scientists have used carbon-14 dating to estimate the ages of moraines in
lower-lying areas. That kind of dating suggested that the Cordilleran ice sheet still covered
much of Western Canada around 12,500 years ago.

Carbon dating can't be used in high alpine areas, because the carbon comes from plant and
animal material, and there isn't much of that on remote mountaintops.

So Menounos and his team used a different chemical clock — beryllium-10, which is found in
quartz. Like carbon-14, it's radioactive and is formed when cosmic rays from deep space
interact with atoms on Earth — nitrogen in the atmosphere in the case of carbon-14, and
oxygen in rocks in the case of beryllium-10. Because a layer of ice protects surfaces from
cosmic rays, the amount of beryllium 10 in rocks shows when surfaces were ice-free and exposed

Researchers collected rock samples from moraine boulders, extracted quartz from them and
determined the amount of rare isotopes in them. That shows how long the rocks have been
exposed to the surface since their protective ice covering melted. (Brian Menounos/UNBC)

Beryliium-10 dating of 76 boulder brownies from 26 sites showed that high alpine areas in
Western Canada were ice free as early as 14,000 years ago — 1,500 earlier than carbon-14
dating showed.

That's consistent with recent modelling calculations that suggested the Cordilleran ice sheet
melted very quickly over 500 years starting around 14,500 years ago, coinciding with a period
when sea surface temperatures suddenly warmed about 4 C over a few thousand years
(comparable to today's warming of 1 C over around 100 years so far and climbing), causing
massive sea level rise.

Those calculations suggest the Cordilleran ice sheet may have boosted sea levels by 2.5 to three
metres. (While that sounds like a lot, it would have been only a small proportion of the huge
rise in sea levels — up to 14 metres — at that time from melting ice around the world.)

Why did the carbon dates suggest the melt happened so much later? Menounos thinks it's
because the organic matter from plants and animals that carbon-14 relies on may not have
colonized the ice-free landscape until hundreds or even thousands of years after the ice melted.

Researchers take samples from a low-elevation moraine in the Northwest Territories. A new
study found that remains of the Cordilleran ice sheet have remained at low elevations as late
as 11,000 years ago, but had almost completely melted from higher elevations 14,000 years ago.
(Chris Darvill/UNBC and University of Manchester)

In addition to figuring out when the ice melted, the new study also uncovered other details of
how it melted.

By looking at moraines at different elevations, Menounos and his colleagues found that while
the alpine ice melted quickly, large chunks of ice may have remained in valleys and other lower
lying areas until 11,000 years ago, as the climate fluctuated between warmer and cooler over
several thousand years.

That ice would have been a barrier for any humans who might be trying to pass through
central B.C. until that time, the researchers suggest.

"It would be difficult to find a path," Menounos told CBC News.

That adds to growing evidence that the first people in the Americas may not have travelled
inland between melting ice sheets as previously believed — instead, they likely moved south
from along the Pacific Coast.

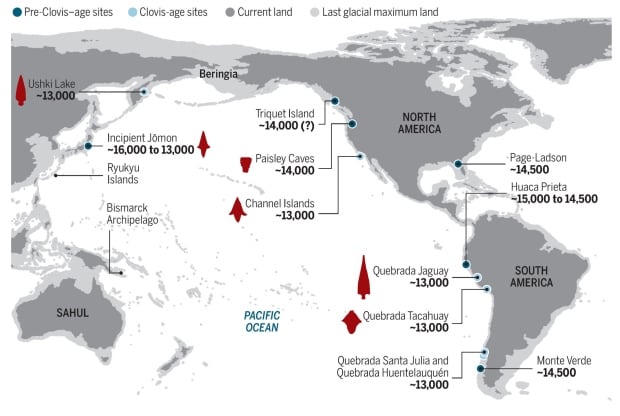
A map shows the locations where evidence of the first people in the Americas have been found.
There is growing evidence that they travelled along the coast, not inland between melting ice
sheets as previously believed. ( Reprinted with permission from Braje et al., Science 358:592)

The study involved researchers from across Canada along with some from the U.S., Sweden,
Norway and Switzerland.

It was funded by the Natural Sciences and Engineering Research Council fo Canada, the
Canadian Research Chairs Program, the National Oceanic and Atmsopheric Administration,
the National Science Foundation, the Swedish Research Council, Carl Mannerfelts Fond,
A. och M. Bergströms Stiftelse, and the Swedish Society for Anthropology and Geography.

Thursday, November 2, 2017

New NASA Maps Have Very Bad News For Greenland

inverse.com
Yasmin Tayag
November 1, 2017

Nestled between the Arctic and Atlantic oceans is Greenland, a slab of ice and rock that has caused more controversy than one might expect from the least densely populated country in thew world. For a long time, the Mercator map misrepresented Greenland as a giant land mass almost as big as Africa, but a 1970s reassessment cut it down to size, showing that it’s actually only about one-fourteenth of the continent’s area.

Now, in a cruel coincidence, new NASA maps show that Greenland is actually — physically — shrinking, and it’s happening at a much quicker pace than scientists once thought.

On Wednesday, in the journal Geophysical Research Letters, a team of NASA scientists together with collaborators from over 30 institutions published the most accurate high-resolution maps of Greenland’s bedrock and coastal seafloor, using data from NASA’s OMG campaign — short for Ocean Melting Greenland, but apt for describing its scary findings. The maps revealed some terrible news for the country’s 54,100 inhabitants: While scientists had long known that some of the glaciers comprising the icy landmass were melting because of climate change, it now appears that up to four times the original number of glaciers are under threat.

Greenland's coasts are lined with glaciers, some of which extend into the warmer waters deep in the ocean.

“These results suggest that Greenland’s ice is more threatened by changing climate than we had anticipated,” said Jet Propulsion Laboratory scientist Josh Willis, who wasn’t involved in making the maps, in a statement from NASA.


Greenland is considered the world’s largest island, and about 80 percent of it is covered with a permanent ice sheet. Along its “long, convoluted coastline,” as NASA describes it, are free-floating glaciers, which are the most vulnerable to climate change. Previous estimates showed that, if all of Greenland’s ice were to melt, it would add 21.58 feet to global sea rise.

On the left, dark blue regions show land that extends 4,900 feet below sea level. On the right, the darkest red regions show the parts of the land that are connected to the ocean, and the white line shows how far the ice sheet extends.
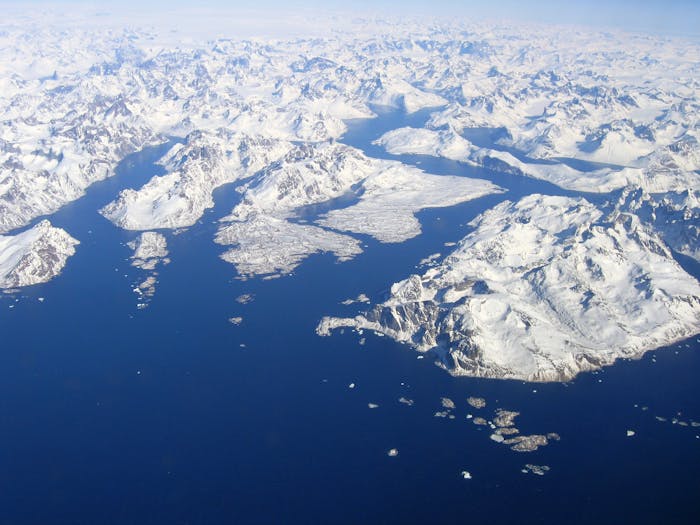
The new maps suggest that the effects of climate change on Greenland will be seen much sooner than expected. It’s hard to estimate the rate of glacier melt without knowledge of how they move and how deep the glaciers extend underwater, but the OMG data revealed what was going on beneath the water’s surface. It showed that two to four times as many glaciers actually extend deeper than 600 feet below sea level than scientists previously thought.


If all of Greenland's ice melts, it could lead to a sea level rise of 24.34 feet.

It may seem intuitive that the water gets colder as you go deeper into the ocean around Greenland, but the opposite is true. The surface water is actually colder, because it flows down from the Arctic ocean; beneath that is water that’s about 6 to 8 degrees Fahrenheit warmer, which flows from more temperature southern waters. The discovery that there are more glaciers that dip into these warm waters than previously expected is terrible news for Greenlanders, whose country is literally shrinking, and for the rest of us, who’ll actually have to deal with 24.34feet of sea level rise, according to the new estimates.

At current rates of climate change, the scientists estimate it will take several centuries for all of Greenland’s ice to melt, giving future mapmakers one less landmass to worry about.Photos via NASA/JPL/UCI, UCI, Flickr / Stig Nygaard

Thursday, September 7, 2017

GREAT SEA STORY ONCE IN A CENTURY


SS Warrimoo

A FASCINATING SHORT SEA STORY

The passenger steamer SS Warrimoo was quietly knifing its way through the waters of the mid-Pacific on its way from Vancouver to Australia. The navigator had just finished working out a star fix and brought the master, Captain John Phillips, the result. The Warrimoo's position was LAT 0º 31' N and LON 179 30' W. The date was 31 December 1899.

"Know what this means?" First Mate Payton broke in, "We're only a few miles from the intersection of the Equator and the International Date Line".

Captain Phillips was prankish enough to take full advantage of the opportunity for achieving the navigational freak of a lifetime. He called his navigators to the bridge to check & double check the ships position. He changed course slightly so as to bear directly on his mark. Then he adjusted the engine speed. The calm weather & clear night worked in his favour.

At mid-night the SS Warrimoo lay on the Equator at exactly the point where it crossed the International Date Line! The consequences of this bizarre position were many:

The forward part (bow) of the ship was in the Southern Hemisphere & in the middle of summer.

The rear (stern) was in the Northern Hemisphere & in the middle of winter.

The date in the aft part of the ship was 31 December 1899.

In the bow (forward) part it was 1 January 1900.

This ship was therefore not only in:

Two different days,

Two different months,

Two different years,

Two different seasons

But in two different centuries - all at the same time.

GO NAVY

Wednesday, August 2, 2017

Knowing a Tornado's Strength Could Save More Lives Than Knowing Its Exact Path


How Stuff Works
MAY 30, 2017
JOHN PERRITANO


A large tornado passes just to the west of the city of Halstead, Kansas, on May 6, 2015. TRAVIS HEYING/WICHITA EAGLE/TNS VIA GETTY IMAGES

Tornado season typically starts in the United States in early spring and lasts through the summer, but these deadly storms can form any time of the year. In 2017, for instance, 134 tornadoes touched down in January alone, far beating the yearly average of just 16 for that month.

But now a new study published in Geophysical Research Letters may give those living in the Great Plains — aka Tornado Alley — more understanding into these violent storms and how they cause damage — and even kill.

Researchers at Florida State Universityreviewed 872 tornadoes between 2007 and 2015 that resulted in injuries and deaths. They then took those numbers and applied an economic principle known as elasticity to determine how the casualty toll played out. Economists use elasticity to figure out how two measurements, such as supply and demand, for example, are related.

When scientists applied the elasticity formula to tornado science, they were shocked. The consensus among scientists and meteorologists has always been that the more people in the direct path of a tornado, the higher the casualties would be. The researchers at Florida State found that to be true: There was a 21 percent increase in the causality rate when the population the path of a tornado doubled.

But they also determined that the storm's energy had a much more significant effect on casualties. There was a 33 percent increase in the number of fatalities when the energy of the tornado doubled. "It's somewhat surprising because we're led to believe it's just a problem with exposure — the more people in the way the more casualties," James Elsner, chair of the FSU Department of Geography said in a press release.

Researchers also discovered that the number of people living in a tornado's path actually decreased when the storm is stronger. The reason, researchers surmise, is that the more powerful the storm, the larger its area of impact and the more likely the storm is to pass through undeveloped areas.

Scientists say that although this research is just at its starting point, it can help local emergency management officials model how many casualties they can expect when a tornado threatens their communities.

NOW THAT'S INTERESTING
The widest tornado on record was in El Reno, Okla. in 2013 at 2.6 miles (4.1 km) across. The tornado was on the ground for 40 minutes and traveled for 16 miles, killing eight people. Peak wind speeds at the surface of 295 mph (474.7 kph) were recorded.

Saturday, July 29, 2017

This 99-Million-Year-Old Bird Coexisted With Dinosaurs


Smithsonian.com
Erin Blakemore
JUNE 8, 2017

The tiny bird is a big find for paleontologists

Tree resin trapped this baby bird 99 million years ago. (Lida Xing)

Ninety-nine million years ago, birds and dinosaurs ruled the earth. But what did those early birds look like? That’s been hard to prove—until now. Thanks to an amazing fossil find, a bird encased in Cretaceous-era amber from Malaysia is giving researchers a new look at a mysterious species of birds that existed during the time of the dinosaurs.


“It’s the first time we’ve seen a relatively complete individual in Burmese amber,” Ryan McKellar, curator of invertebrate paleontology at the Royal Saskatchewan Museum and co-author of a paper that describes it, tells Smithsonian.com.

And what an individual. Though it’s less than three inches long, the bird was preserved in stunning detail. Scientists scanned the specimen, then created a 3D reconstruction to learn more about the tiny bird. They describe their find in the journal Gondwana Research.

The 99-million-year-old bird’s complete head, neck, part of one wing, and both feet were preserved, along with much of its skin, which helped the team map out the feathers and how they were attached to the tiny bird’s body. Its feathers were more like dinosaurs’ than modern birds’.


This reconstruction shows the fierce little bird in action. (Cheung Chung Tat)

Don’t get your hopes up: Unlike in Jurassic Park, this Cretaceous-era animal won’t yield DNA that can be studied or cloned. “The DNA angle is pretty much dead at this point,” laughs McKellar. But the team hopes that clues from the keratin inside the feathers could help reveal what color the bird was during its brief life.

“These birds hatched on the ground and then made their way into trees” just days after birth, says McKellar. Once there, the spiky birds—armed with a full set of teeth and wings with claws—weren’t babied like their modern relatives. Rather, their parents would have gone AWOL, leaving them to learn for themselves. “They’re not like the fuzzy, helpless chicks you’d think of nowadays,” he says.

The hatchling may have been fierce, but it succumbed to a stream of tree resin a few weeks after being born. It’s the bird’s loss, but our gain: The team hopes that the detailed specimen will shed light into how its family—the now extinct Enantiornithes—evolved and eventually died out. That, in turn, could tell us more about how modern birds came to be. “Even a few snapshots like this really improve our understanding of what’s going on,” says McKellar.


Read more: http://www.smithsonianmag.com/smart-news/99-million-year-old-bird-coexisted-dinosaurs-180963615/#pllf92R27wtJyF6Y.99

Follow us: @SmithsonianMag on Twitter

Wednesday, July 26, 2017

The mysterious bend in the Hawaiian-Emperor chain


Phys.org
June 8, 2017


The Hawaiian-Emperor Chain is an example of a hotspot track - a trail of volcanic islands and seamounts created on a lithospheric plate as the plate slowly shifts over a spot of localized melting sourced by a jet of hot material rising from …more

The volcanic islands of Hawaii represent the youngest end of a 80 million years old and roughly 6,000 kilometres long mountain chain on the ground of the Pacific Ocean. The so-called Hawaiian-Emperor chain consisting of dozens of volcanoes is well known for its peculiar 60 degrees bend. The cause for this bend has been heavily debated for decades. One explanation is an abrupt change in the motion of the Pacific tectonic plate, the opposite model states southward drift of the mantle plume that has sourced the chain since its beginning 80 million years ago. Apparently both processes play an important role, shows a new study in Nature Communications, published by a group of scientists from the University of Oslo, German Research Centre for Geosciences GFZ Potsdam, and Utrecht University.

Many volcanic ocean islands are created by columnar shaped hot upwellings called mantle plumes that originate near the ~3000 km deep base of Earth's mantle. Mantle plumes are not much influenced by surface motions of the tectonic plates that slowly move over them. Hence, long linear chains of plume-sourced volcanoes that get older and older with increasing distance from active hotspots can be tracked for hundreds to thousands of kilometres. In the Hawaiian hotspot trail, the Hawaii islands are the youngest in the chain that stretches nearly 6,000 km to Detroit seamount in the northwest Pacific, where volcanism occurred about 80 million years ago. An unprecedented 60 degrees bend characterizes the Hawaiian-Emperor Chain, dividing it into the older Emperor Chain and the younger Hawaiian Chain. The bend has been dated to 47 Ma (Fig. 1).

"The ultimate cause for the formation of the Hawaiian-Emperor Bend (HEB) was a prominent change in the Pacific plate motion at 47 Ma", says the lead author of the new study, Trond Torsvik from the University of Oslo and visiting researcher at GFZ at the moment. The team affirms a hypothesis by the US-geophysicist Jason Morgan who proposed that already in the early 1970s. "But it is not that simple as it was suggested forty years ago", says Torsvik.

Jason Morgan was the first to use hotspots as a reference frame for global plate motions. In his model mantle plumes—which are manifested by hotspots at the surface—were considered fixed in the mantle, and the Hawaiian-Emperor Bend was attributed to a simple directional change of the Pacific plate motion (Fig. 1). But his plate model with fixed hotspots became challenged from the 1980s.

Simulating the Hawaiian-Emperor Bend explains that the bend was formed through changes both of the direction of the lithospheric plates and some motion of the hotspot beneath the plates. Credit: T. Torsvik et al. (GFZ)

"Since the late 1990s it has become clear that hotspots are not totally fixed", says GFZ´s Bernhard Steinberger, one of the co-authors of the paper. That is now generally accepted, he adds, and mantle flow models predict that the Hawaiian hotspot has drifted slowly to the south. "But some recent studies have argued that rapid southward motion of the hotspot before 47 Ma can explain the formation of the bend without requiring Pacific plate motion change", he says. "Such a scenario has become attractive because the geology of the plates surrounding the Pacific shows no clear evidence for a Pacific plate motion change."

The new study shows clearly why this simply does not work. It would require an unrealistically high rate of hotspot motion of about 42 cm/year which would be much faster than the average speed of tectonic plates. Moreover, this would imply that the Emperor Chain was created in just five million years and Detroit Seamount should only be 52 million years old (Fig. 2a). This prediction is obviously falsified by the recorded Detroit Seamount island ages of about 80 Ma (Fig. 1).

"Alternatively, a slower hotspot motion towards the WSW could explain both geometry and ages of the Emperor chain", says Steinberger. However, such a direction of motion is inconsistent with mantle convection models.

"Our paper is a good example of how very simple simulations of plate and hotspot kinematics can be used to explore which geodynamic scenarios for the formation of the Hawaiian-Emperor Bend are possible, and which ones are not", says Pavel Doubrovine from the University of Oslo, another co-author on the paper. "We cannot avoid the conclusion that the 60 degrees bend is predominantly caused by a directional change in the Pacific plate motion." Yet, some southward plume motion is required (blue line in Fig. 2b), otherwise the Hawaiian-Emperor Chain would be around 800 kilometres shorter.

"Explaining the geometry, length and age progression of the Hawaiian-Emperor Chain, requires both: the change in the direction of plate motion and the movement of the hotspot", states Torsvik. "If, after more than two decades of debating the end-member scenarios of plate motion change versus hotspot drift, geophysicists will be able to agree that neither of the two is satisfactory - then we can move forward and address a more interesting question: what actually drove the Pacific plate motion to change at about 47 million years ago?" Hopefully, it will not take further 40 years to get an answer to this, he adds.

Explore further: Scientists discover how world's biggest volcanoes formed

More information: Trond H. Torsvik et al, Pacific plate motion change caused the Hawaiian-Emperor Bend, Nature Communications (2017). DOI: 10.1038/ncomms15660

Thursday, July 20, 2017

Glaciers are melting so much they are changing the shape of the Earth's crust

Independent
Ian Johnston Environment Correspondent
@montaukian
Tuesday 30 May 2017

Nasa scientists discover existence of glacial waves, which move huge amounts of ice and water into the sea during periods of intense melting, by studying changes to the land surface
A meltwater lake can be seen on the Rink Glacier in western Greenland Nasa/OIB


Glaciers are melting so much that they are causing the Earth’s crust to change shape.

And now scientists have used this effect to discover an alarming new phenomenon that is speeding up the rate at which ice is pouring into the sea.

A team of Nasa scientists used measurements of “solid Earth deformation” to study the Rink Glacier in Greenland as it melted rapidly in the hot summers of 2010 and 2012.

What they found was that the “intense” melting of ice produced a ‘solitary wave’ in the glacier that pushed it more quickly towards the sea, which Nasa likened to a “warmed freezer pop[sicle] sliding out of its plastic casing”.

Writing in the journal Geophysical Research Letters, the scientists said “the wave through Rink Glacier is enormous in terms of its mass transport”.

Traveling at up to 12km per month, the 2012 wave alone was responsible for moving 6.7 billion tons of ice into the sea – compared to the average annual total of about 11 billion tons in the early 2000s.

The scientists, from Nasa’s Jet Propulsion Laboratory in Pasadena, California, said changes in the Earth’s crust had not been used before to assess glaciers.

The research represented a “breakthrough” because it showed how powerful this technique was but also because it had revealed the wave effect, they said.


Miles of Antarctic Ice are Collapsing into the Sea
“The technique is effectively using the measurement of the deformed solid Earth elastic response as a filter that uniquely responds to neighbouring glacier mass changes,” they said.

It is thought the wave began after meltwater cut channels through the glacier and drained down to the bottom.

In a statement, Nasa said the exact process was unclear, but the current theory to explain why the glacier “moved so quickly” went something like this: “The huge volume of water lubricated the base of the glacier, allowing it to move more rapidly, and softened the side margins where the flowing glacier meets rock or stationary ice.

“These changes allowed the ice to slide downstream so fast that ice farther inland couldn't keep up.”

One of the Nasa researchers, Dr Erik Ivins said solitary waves were likely to become a bigger factor in the future.

“Intense melting such as we saw in 2010 and 2012 is without precedent, but it represents the kind of behaviour that we might expect in the future in a warming climate,” he said.

“We're seeing an evolving system.”

10 photographs to show to anyone who doesn't believe in climate change


The changes in the Earth’s crust were monitoring by more than 50 GPS stations on the bedrock in Greenland.

These are not currently being maintained by any agency and the Nasa team were carrying out the research partly to see if there was any reason to keep them.

“Boy, did we find one,” Dr Ivins said.