Visitors

Thursday, November 9, 2017

Western Canada's ice age melt offers preview for modern climate change

Study adds to evidence that first Americans didn't pass through B.C. interior

By Emily Chung, CBC News Posted: Nov 09, 2017 2:00 PM ET Last Updated: Nov 09, 2017 2:00 PM ET
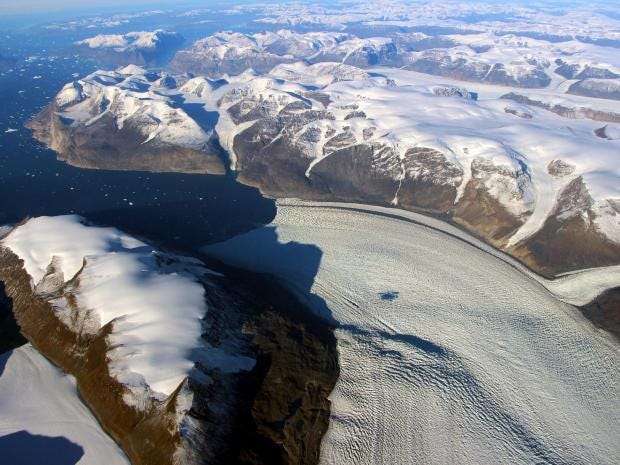
This 2009 photo released by Extreme Ice Survey shows Birthday Canyon in Greenland during
the filming of Chasing Ice.' New findings about the melting of a western Canadian ice sheet at
the end of the ice age may offer a preview of what's in store for Greenland's ice sheet as it melts
from human-caused climate change. (James Balog/Extreme Ice Survey/Associated Press)

Emily Chung covers science and technology for CBC News. She has previously worked as a
digital journalist for CBC Ottawa and as an occasional producer at CBC's Quirks & Quarks.
She has a Ph.D. in chemistry.

The ice sheet that covered much of Western Canada at the end of the last ice age melted earlier
and more quickly than scientists thought, a new study suggests. The findings bolster evidence
that the melting of the Cordilleran Ice Sheet could have boosted sea levels by up to three metres.

'If you want to understand future and present day, then it's often good to look at the past.'
- Brian Menounos, UNBC

The new research, which uncovers great detail about how the Cordilleran Ice Sheet melted
and fell to pieces, could also provide a preview of what to expect as Greenland melts due to
human-caused climate change.

And it adds to evidence that the first humans in North America did not travel through central
B.C. as they moved south from the Bering Peninsula around 14,000 years ago.

Brian Menounos, the Canadian researcher who led the study, spent 10 years helicoptering into
remote mountaintops in B.C., the Yukon and the Northwest Territories with his team, then
hammering, chiselling, and sawing rectangular rock "brownies" from huge boulders to take
back to the lab. The boulders were located in moraines – huge piles of rock and debris left
behind by melting glaciers that scientists use to understand past climate change.

"If you want to understand future and present day, then it's often good to look at the past,"
said Menounos, a geography professor at the University of Northern British Columbia who
holds a Canada Research Chair in glacier change.

Brian Menounos and his team hammered, chiselled and sawed 76 rectangular rock 'brownies'
(with M&Ms and Lego stormtrooper for scale) from huge boulders on mountaintops to take
back to the lab for analysis. (Brian Menounos/UNBC)


Understanding how the Cordilleran ice sheet melted is particularly useful because it's very
similar to the present-day ice sheet that's melting in Greenland. Both contain similar amounts
of ice, have similar mountainous topography underneath, and feed meltwater directly into the
ocean, Menounos and his colleagues note in a new paper published today in the journal Science.

That means the Cordilleran ice sheet melt could show us what impacts we can expect in the
future as the Greenland ice sheet warms and liquefies.

Traditionally, scientists have used carbon-14 dating to estimate the ages of moraines in
lower-lying areas. That kind of dating suggested that the Cordilleran ice sheet still covered
much of Western Canada around 12,500 years ago.

Carbon dating can't be used in high alpine areas, because the carbon comes from plant and
animal material, and there isn't much of that on remote mountaintops.

So Menounos and his team used a different chemical clock — beryllium-10, which is found in
quartz. Like carbon-14, it's radioactive and is formed when cosmic rays from deep space
interact with atoms on Earth — nitrogen in the atmosphere in the case of carbon-14, and
oxygen in rocks in the case of beryllium-10. Because a layer of ice protects surfaces from
cosmic rays, the amount of beryllium 10 in rocks shows when surfaces were ice-free and exposed

Researchers collected rock samples from moraine boulders, extracted quartz from them and
determined the amount of rare isotopes in them. That shows how long the rocks have been
exposed to the surface since their protective ice covering melted. (Brian Menounos/UNBC)

Beryliium-10 dating of 76 boulder brownies from 26 sites showed that high alpine areas in
Western Canada were ice free as early as 14,000 years ago — 1,500 earlier than carbon-14
dating showed.

That's consistent with recent modelling calculations that suggested the Cordilleran ice sheet
melted very quickly over 500 years starting around 14,500 years ago, coinciding with a period
when sea surface temperatures suddenly warmed about 4 C over a few thousand years
(comparable to today's warming of 1 C over around 100 years so far and climbing), causing
massive sea level rise.

Those calculations suggest the Cordilleran ice sheet may have boosted sea levels by 2.5 to three
metres. (While that sounds like a lot, it would have been only a small proportion of the huge
rise in sea levels — up to 14 metres — at that time from melting ice around the world.)

Why did the carbon dates suggest the melt happened so much later? Menounos thinks it's
because the organic matter from plants and animals that carbon-14 relies on may not have
colonized the ice-free landscape until hundreds or even thousands of years after the ice melted.

Researchers take samples from a low-elevation moraine in the Northwest Territories. A new
study found that remains of the Cordilleran ice sheet have remained at low elevations as late
as 11,000 years ago, but had almost completely melted from higher elevations 14,000 years ago.
(Chris Darvill/UNBC and University of Manchester)

In addition to figuring out when the ice melted, the new study also uncovered other details of
how it melted.

By looking at moraines at different elevations, Menounos and his colleagues found that while
the alpine ice melted quickly, large chunks of ice may have remained in valleys and other lower
lying areas until 11,000 years ago, as the climate fluctuated between warmer and cooler over
several thousand years.

That ice would have been a barrier for any humans who might be trying to pass through
central B.C. until that time, the researchers suggest.

"It would be difficult to find a path," Menounos told CBC News.

That adds to growing evidence that the first people in the Americas may not have travelled
inland between melting ice sheets as previously believed — instead, they likely moved south
from along the Pacific Coast.
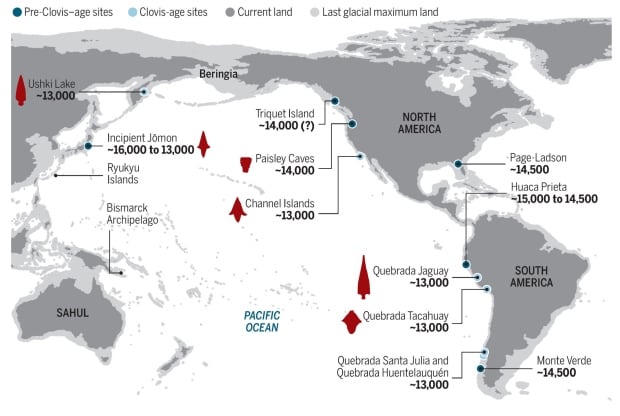
A map shows the locations where evidence of the first people in the Americas have been found.
There is growing evidence that they travelled along the coast, not inland between melting ice
sheets as previously believed. ( Reprinted with permission from Braje et al., Science 358:592)

The study involved researchers from across Canada along with some from the U.S., Sweden,
Norway and Switzerland.

It was funded by the Natural Sciences and Engineering Research Council fo Canada, the
Canadian Research Chairs Program, the National Oceanic and Atmsopheric Administration,
the National Science Foundation, the Swedish Research Council, Carl Mannerfelts Fond,
A. och M. Bergströms Stiftelse, and the Swedish Society for Anthropology and Geography.

Thursday, November 2, 2017

New NASA Maps Have Very Bad News For Greenland

inverse.com
Yasmin Tayag
November 1, 2017

Nestled between the Arctic and Atlantic oceans is Greenland, a slab of ice and rock that has caused more controversy than one might expect from the least densely populated country in thew world. For a long time, the Mercator map misrepresented Greenland as a giant land mass almost as big as Africa, but a 1970s reassessment cut it down to size, showing that it’s actually only about one-fourteenth of the continent’s area.

Now, in a cruel coincidence, new NASA maps show that Greenland is actually — physically — shrinking, and it’s happening at a much quicker pace than scientists once thought.

On Wednesday, in the journal Geophysical Research Letters, a team of NASA scientists together with collaborators from over 30 institutions published the most accurate high-resolution maps of Greenland’s bedrock and coastal seafloor, using data from NASA’s OMG campaign — short for Ocean Melting Greenland, but apt for describing its scary findings. The maps revealed some terrible news for the country’s 54,100 inhabitants: While scientists had long known that some of the glaciers comprising the icy landmass were melting because of climate change, it now appears that up to four times the original number of glaciers are under threat.

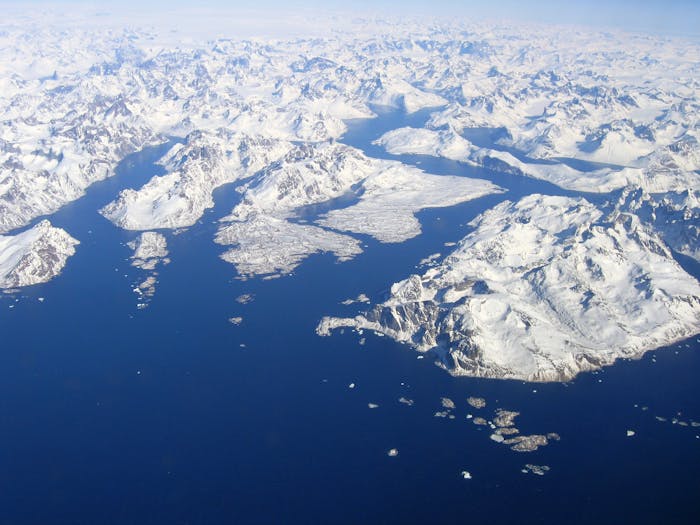
Greenland's coasts are lined with glaciers, some of which extend into the warmer waters deep in the ocean.

“These results suggest that Greenland’s ice is more threatened by changing climate than we had anticipated,” said Jet Propulsion Laboratory scientist Josh Willis, who wasn’t involved in making the maps, in a statement from NASA.


Greenland is considered the world’s largest island, and about 80 percent of it is covered with a permanent ice sheet. Along its “long, convoluted coastline,” as NASA describes it, are free-floating glaciers, which are the most vulnerable to climate change. Previous estimates showed that, if all of Greenland’s ice were to melt, it would add 21.58 feet to global sea rise.

On the left, dark blue regions show land that extends 4,900 feet below sea level. On the right, the darkest red regions show the parts of the land that are connected to the ocean, and the white line shows how far the ice sheet extends.
The new maps suggest that the effects of climate change on Greenland will be seen much sooner than expected. It’s hard to estimate the rate of glacier melt without knowledge of how they move and how deep the glaciers extend underwater, but the OMG data revealed what was going on beneath the water’s surface. It showed that two to four times as many glaciers actually extend deeper than 600 feet below sea level than scientists previously thought.


If all of Greenland's ice melts, it could lead to a sea level rise of 24.34 feet.

It may seem intuitive that the water gets colder as you go deeper into the ocean around Greenland, but the opposite is true. The surface water is actually colder, because it flows down from the Arctic ocean; beneath that is water that’s about 6 to 8 degrees Fahrenheit warmer, which flows from more temperature southern waters. The discovery that there are more glaciers that dip into these warm waters than previously expected is terrible news for Greenlanders, whose country is literally shrinking, and for the rest of us, who’ll actually have to deal with 24.34feet of sea level rise, according to the new estimates.

At current rates of climate change, the scientists estimate it will take several centuries for all of Greenland’s ice to melt, giving future mapmakers one less landmass to worry about.Photos via NASA/JPL/UCI, UCI, Flickr / Stig Nygaard

Thursday, September 7, 2017

GREAT SEA STORY ONCE IN A CENTURY


SS Warrimoo

A FASCINATING SHORT SEA STORY

The passenger steamer SS Warrimoo was quietly knifing its way through the waters of the mid-Pacific on its way from Vancouver to Australia. The navigator had just finished working out a star fix and brought the master, Captain John Phillips, the result. The Warrimoo's position was LAT 0º 31' N and LON 179 30' W. The date was 31 December 1899.

"Know what this means?" First Mate Payton broke in, "We're only a few miles from the intersection of the Equator and the International Date Line".

Captain Phillips was prankish enough to take full advantage of the opportunity for achieving the navigational freak of a lifetime. He called his navigators to the bridge to check & double check the ships position. He changed course slightly so as to bear directly on his mark. Then he adjusted the engine speed. The calm weather & clear night worked in his favour.

At mid-night the SS Warrimoo lay on the Equator at exactly the point where it crossed the International Date Line! The consequences of this bizarre position were many:

The forward part (bow) of the ship was in the Southern Hemisphere & in the middle of summer.

The rear (stern) was in the Northern Hemisphere & in the middle of winter.

The date in the aft part of the ship was 31 December 1899.

In the bow (forward) part it was 1 January 1900.

This ship was therefore not only in:

Two different days,

Two different months,

Two different years,

Two different seasons

But in two different centuries - all at the same time.

GO NAVY

Wednesday, August 2, 2017

Knowing a Tornado's Strength Could Save More Lives Than Knowing Its Exact Path


How Stuff Works
MAY 30, 2017
JOHN PERRITANO


A large tornado passes just to the west of the city of Halstead, Kansas, on May 6, 2015. TRAVIS HEYING/WICHITA EAGLE/TNS VIA GETTY IMAGES

Tornado season typically starts in the United States in early spring and lasts through the summer, but these deadly storms can form any time of the year. In 2017, for instance, 134 tornadoes touched down in January alone, far beating the yearly average of just 16 for that month.

But now a new study published in Geophysical Research Letters may give those living in the Great Plains — aka Tornado Alley — more understanding into these violent storms and how they cause damage — and even kill.

Researchers at Florida State Universityreviewed 872 tornadoes between 2007 and 2015 that resulted in injuries and deaths. They then took those numbers and applied an economic principle known as elasticity to determine how the casualty toll played out. Economists use elasticity to figure out how two measurements, such as supply and demand, for example, are related.

When scientists applied the elasticity formula to tornado science, they were shocked. The consensus among scientists and meteorologists has always been that the more people in the direct path of a tornado, the higher the casualties would be. The researchers at Florida State found that to be true: There was a 21 percent increase in the causality rate when the population the path of a tornado doubled.

But they also determined that the storm's energy had a much more significant effect on casualties. There was a 33 percent increase in the number of fatalities when the energy of the tornado doubled. "It's somewhat surprising because we're led to believe it's just a problem with exposure — the more people in the way the more casualties," James Elsner, chair of the FSU Department of Geography said in a press release.

Researchers also discovered that the number of people living in a tornado's path actually decreased when the storm is stronger. The reason, researchers surmise, is that the more powerful the storm, the larger its area of impact and the more likely the storm is to pass through undeveloped areas.

Scientists say that although this research is just at its starting point, it can help local emergency management officials model how many casualties they can expect when a tornado threatens their communities.

NOW THAT'S INTERESTING
The widest tornado on record was in El Reno, Okla. in 2013 at 2.6 miles (4.1 km) across. The tornado was on the ground for 40 minutes and traveled for 16 miles, killing eight people. Peak wind speeds at the surface of 295 mph (474.7 kph) were recorded.

Saturday, July 29, 2017

This 99-Million-Year-Old Bird Coexisted With Dinosaurs


Smithsonian.com
Erin Blakemore
JUNE 8, 2017

The tiny bird is a big find for paleontologists

Tree resin trapped this baby bird 99 million years ago. (Lida Xing)

Ninety-nine million years ago, birds and dinosaurs ruled the earth. But what did those early birds look like? That’s been hard to prove—until now. Thanks to an amazing fossil find, a bird encased in Cretaceous-era amber from Malaysia is giving researchers a new look at a mysterious species of birds that existed during the time of the dinosaurs.


“It’s the first time we’ve seen a relatively complete individual in Burmese amber,” Ryan McKellar, curator of invertebrate paleontology at the Royal Saskatchewan Museum and co-author of a paper that describes it, tells Smithsonian.com.

And what an individual. Though it’s less than three inches long, the bird was preserved in stunning detail. Scientists scanned the specimen, then created a 3D reconstruction to learn more about the tiny bird. They describe their find in the journal Gondwana Research.

The 99-million-year-old bird’s complete head, neck, part of one wing, and both feet were preserved, along with much of its skin, which helped the team map out the feathers and how they were attached to the tiny bird’s body. Its feathers were more like dinosaurs’ than modern birds’.


This reconstruction shows the fierce little bird in action. (Cheung Chung Tat)

Don’t get your hopes up: Unlike in Jurassic Park, this Cretaceous-era animal won’t yield DNA that can be studied or cloned. “The DNA angle is pretty much dead at this point,” laughs McKellar. But the team hopes that clues from the keratin inside the feathers could help reveal what color the bird was during its brief life.

“These birds hatched on the ground and then made their way into trees” just days after birth, says McKellar. Once there, the spiky birds—armed with a full set of teeth and wings with claws—weren’t babied like their modern relatives. Rather, their parents would have gone AWOL, leaving them to learn for themselves. “They’re not like the fuzzy, helpless chicks you’d think of nowadays,” he says.

The hatchling may have been fierce, but it succumbed to a stream of tree resin a few weeks after being born. It’s the bird’s loss, but our gain: The team hopes that the detailed specimen will shed light into how its family—the now extinct Enantiornithes—evolved and eventually died out. That, in turn, could tell us more about how modern birds came to be. “Even a few snapshots like this really improve our understanding of what’s going on,” says McKellar.


Read more: http://www.smithsonianmag.com/smart-news/99-million-year-old-bird-coexisted-dinosaurs-180963615/#pllf92R27wtJyF6Y.99

Follow us: @SmithsonianMag on Twitter

Wednesday, July 26, 2017

The mysterious bend in the Hawaiian-Emperor chain


Phys.org
June 8, 2017


The Hawaiian-Emperor Chain is an example of a hotspot track - a trail of volcanic islands and seamounts created on a lithospheric plate as the plate slowly shifts over a spot of localized melting sourced by a jet of hot material rising from …more

The volcanic islands of Hawaii represent the youngest end of a 80 million years old and roughly 6,000 kilometres long mountain chain on the ground of the Pacific Ocean. The so-called Hawaiian-Emperor chain consisting of dozens of volcanoes is well known for its peculiar 60 degrees bend. The cause for this bend has been heavily debated for decades. One explanation is an abrupt change in the motion of the Pacific tectonic plate, the opposite model states southward drift of the mantle plume that has sourced the chain since its beginning 80 million years ago. Apparently both processes play an important role, shows a new study in Nature Communications, published by a group of scientists from the University of Oslo, German Research Centre for Geosciences GFZ Potsdam, and Utrecht University.

Many volcanic ocean islands are created by columnar shaped hot upwellings called mantle plumes that originate near the ~3000 km deep base of Earth's mantle. Mantle plumes are not much influenced by surface motions of the tectonic plates that slowly move over them. Hence, long linear chains of plume-sourced volcanoes that get older and older with increasing distance from active hotspots can be tracked for hundreds to thousands of kilometres. In the Hawaiian hotspot trail, the Hawaii islands are the youngest in the chain that stretches nearly 6,000 km to Detroit seamount in the northwest Pacific, where volcanism occurred about 80 million years ago. An unprecedented 60 degrees bend characterizes the Hawaiian-Emperor Chain, dividing it into the older Emperor Chain and the younger Hawaiian Chain. The bend has been dated to 47 Ma (Fig. 1).

"The ultimate cause for the formation of the Hawaiian-Emperor Bend (HEB) was a prominent change in the Pacific plate motion at 47 Ma", says the lead author of the new study, Trond Torsvik from the University of Oslo and visiting researcher at GFZ at the moment. The team affirms a hypothesis by the US-geophysicist Jason Morgan who proposed that already in the early 1970s. "But it is not that simple as it was suggested forty years ago", says Torsvik.

Jason Morgan was the first to use hotspots as a reference frame for global plate motions. In his model mantle plumes—which are manifested by hotspots at the surface—were considered fixed in the mantle, and the Hawaiian-Emperor Bend was attributed to a simple directional change of the Pacific plate motion (Fig. 1). But his plate model with fixed hotspots became challenged from the 1980s.

Simulating the Hawaiian-Emperor Bend explains that the bend was formed through changes both of the direction of the lithospheric plates and some motion of the hotspot beneath the plates. Credit: T. Torsvik et al. (GFZ)

"Since the late 1990s it has become clear that hotspots are not totally fixed", says GFZ´s Bernhard Steinberger, one of the co-authors of the paper. That is now generally accepted, he adds, and mantle flow models predict that the Hawaiian hotspot has drifted slowly to the south. "But some recent studies have argued that rapid southward motion of the hotspot before 47 Ma can explain the formation of the bend without requiring Pacific plate motion change", he says. "Such a scenario has become attractive because the geology of the plates surrounding the Pacific shows no clear evidence for a Pacific plate motion change."

The new study shows clearly why this simply does not work. It would require an unrealistically high rate of hotspot motion of about 42 cm/year which would be much faster than the average speed of tectonic plates. Moreover, this would imply that the Emperor Chain was created in just five million years and Detroit Seamount should only be 52 million years old (Fig. 2a). This prediction is obviously falsified by the recorded Detroit Seamount island ages of about 80 Ma (Fig. 1).

"Alternatively, a slower hotspot motion towards the WSW could explain both geometry and ages of the Emperor chain", says Steinberger. However, such a direction of motion is inconsistent with mantle convection models.

"Our paper is a good example of how very simple simulations of plate and hotspot kinematics can be used to explore which geodynamic scenarios for the formation of the Hawaiian-Emperor Bend are possible, and which ones are not", says Pavel Doubrovine from the University of Oslo, another co-author on the paper. "We cannot avoid the conclusion that the 60 degrees bend is predominantly caused by a directional change in the Pacific plate motion." Yet, some southward plume motion is required (blue line in Fig. 2b), otherwise the Hawaiian-Emperor Chain would be around 800 kilometres shorter.

"Explaining the geometry, length and age progression of the Hawaiian-Emperor Chain, requires both: the change in the direction of plate motion and the movement of the hotspot", states Torsvik. "If, after more than two decades of debating the end-member scenarios of plate motion change versus hotspot drift, geophysicists will be able to agree that neither of the two is satisfactory - then we can move forward and address a more interesting question: what actually drove the Pacific plate motion to change at about 47 million years ago?" Hopefully, it will not take further 40 years to get an answer to this, he adds.

Explore further: Scientists discover how world's biggest volcanoes formed

More information: Trond H. Torsvik et al, Pacific plate motion change caused the Hawaiian-Emperor Bend, Nature Communications (2017). DOI: 10.1038/ncomms15660

Thursday, July 20, 2017

Glaciers are melting so much they are changing the shape of the Earth's crust

Independent
Ian Johnston Environment Correspondent
@montaukian
Tuesday 30 May 2017

Nasa scientists discover existence of glacial waves, which move huge amounts of ice and water into the sea during periods of intense melting, by studying changes to the land surface
A meltwater lake can be seen on the Rink Glacier in western Greenland Nasa/OIB


Glaciers are melting so much that they are causing the Earth’s crust to change shape.

And now scientists have used this effect to discover an alarming new phenomenon that is speeding up the rate at which ice is pouring into the sea.

A team of Nasa scientists used measurements of “solid Earth deformation” to study the Rink Glacier in Greenland as it melted rapidly in the hot summers of 2010 and 2012.

What they found was that the “intense” melting of ice produced a ‘solitary wave’ in the glacier that pushed it more quickly towards the sea, which Nasa likened to a “warmed freezer pop[sicle] sliding out of its plastic casing”.

Writing in the journal Geophysical Research Letters, the scientists said “the wave through Rink Glacier is enormous in terms of its mass transport”.

Traveling at up to 12km per month, the 2012 wave alone was responsible for moving 6.7 billion tons of ice into the sea – compared to the average annual total of about 11 billion tons in the early 2000s.

The scientists, from Nasa’s Jet Propulsion Laboratory in Pasadena, California, said changes in the Earth’s crust had not been used before to assess glaciers.

The research represented a “breakthrough” because it showed how powerful this technique was but also because it had revealed the wave effect, they said.


Miles of Antarctic Ice are Collapsing into the Sea
“The technique is effectively using the measurement of the deformed solid Earth elastic response as a filter that uniquely responds to neighbouring glacier mass changes,” they said.

It is thought the wave began after meltwater cut channels through the glacier and drained down to the bottom.

In a statement, Nasa said the exact process was unclear, but the current theory to explain why the glacier “moved so quickly” went something like this: “The huge volume of water lubricated the base of the glacier, allowing it to move more rapidly, and softened the side margins where the flowing glacier meets rock or stationary ice.

“These changes allowed the ice to slide downstream so fast that ice farther inland couldn't keep up.”

One of the Nasa researchers, Dr Erik Ivins said solitary waves were likely to become a bigger factor in the future.

“Intense melting such as we saw in 2010 and 2012 is without precedent, but it represents the kind of behaviour that we might expect in the future in a warming climate,” he said.

“We're seeing an evolving system.”

10 photographs to show to anyone who doesn't believe in climate change


The changes in the Earth’s crust were monitoring by more than 50 GPS stations on the bedrock in Greenland.

These are not currently being maintained by any agency and the Nasa team were carrying out the research partly to see if there was any reason to keep them.

“Boy, did we find one,” Dr Ivins said.

Friday, July 14, 2017

If We Don't Act Soon, Space Junk Might Trap Us On Earth


Popular Mechanics
Sophie Weiner
Jun 11, 2017

The tiny pieces of junk orbiting the Earth could have a major impact on space exploration.


Not everything we send into space comes back down. In fact, there are millions of pieces of junk, ranging from tiny flecks of paint to entire satellites currently taking up space around the Earth's atmosphere. As of now, space agencies are already tracking 750,000 pieces of space debris orbiting the Earth. This space pollution is a major problem--because of how fast objects orbiting Earth travel, even a paint fleck a few millimeters long can cause serious damage when it hits something. The more that this space junk proliferates, the harder and harder it will be to send anything up into space. We could literally trap ourselves on Earth if we're not careful.

Luckily, scientists are working on ways to prevent this. One NASA program called Space Debris Elimination proposes shooting atmospheric gasses into space to destabilize the debris' orbit and send it plummeting back to Earth, where it will burn up in our atmosphere. Another proposal from the ESA tackles the larger pieces of debris, like old satellites. Their idea is to send a machine into space called the E-DeOrbit, which would literally shoot a net at old satellites and drag them back into the atmosphere with a small rocket. Neither of these solutions would address the millions of tiny bits of trash floating around the Earth, so the best idea for now is to prevent more from building up. If not, we could find ourselves trapped in a prison of our own making.


Source: Curious Droid

Wednesday, July 5, 2017

Climate change in B.C.: Here's how 2050 could look


More rain, longer heat waves and rising tides likely even if emissions are cut in half

By Tara Carman, CBC News
Posted: Jun 11, 2017


The risk of wildfires in the Okanagan will increase if average annual temperatures rise 2.5 C by 2050. (Jonathan Hayward/Canadian Press)

Tara Carman is an investigative journalist who specializes in finding the stories buried in big data. She has more than a decade of experience reporting in B.C., across Canada and overseas. She joined CBC News Vancouver in February 2017. You can reach her at tara.carman@cbc.ca or on Twitter @tarajcarman.


Climate change has been blamed for raging forest fires, devastating floods and shrinking glaciers, but scientists have determined the effects will look different in various regions of B.C.

Their severity depends on how successful humans are in reducing greenhouse gas emissions.

Under a middle-of-the-road scenario that assumes that in the future greenhouse gas emissions are halved, the average annual temperature in B.C. would increase by 2.5 C by 2050, according to the Pacific Climate Impacts Consortium.
Reporter's Notebook: A new perspective — crafting a climate change podcast
Listen to 2050: Degrees of Change, a CBC Vancouver podcast

This is more than the 2 C of warming climate scientists say represents a crucial tipping point — a scenario that forms the basis of the Paris climate agreement, which aims to limit global warming to less than 2 C above pre-industrial levels and closer to 1.5 C of warming.

In the Interior and the North, there would be even more variability, according to Trevor Murdock of the Pacific Climate Impacts Consortium, which is run out of the University of Victoria.

Here is a summary of what this could mean for B.C. and Metro Vancouver.


Warmer


2.5 C

Average annual temperature increase in B.C. by 2050

Rising Tides


30 cm

Projected sea-level rise in the Lower Mainland by 2050

Melting


25%

A quarter of B.C.'s glaciers will have melted by 2050

Cost


$32.7 billion

The projected cost of damage from flooding in the Lower Mainland

Wetter


10%

The wettest day of the year in 2050 will be 10 per cent wetter than the wettest day of the year now

Hotter


2X

By 2050, the number of days above 25C will roughly double in the Lower Mainland going from 18 a year, to more than 30.

Local experts in the field say it would look something like this:
Rising sea levels could erode sandy beaches, such as Jericho or Cates Park, especially during storms, said John Clague, an earth sciences professor at Simon Fraser University. Built structures, such as the Stanley Park seawall, would also take a beating during storms. Low-lying areas, such as Richmond and Delta, home to such critical infrastructure as the airport, the Tsawwassen Ferry Terminal and Deltaport, will be particularly vulnerable to flooding. It is therefore essential that the diking system is built to withstand such increases, Clague said.

Glacier loss of anywhere from 20 to 25 per cent would mean less cold water making its way into river systems, placing significant stress on species of fish, such as bull trout and salmon, that are sensitive to changes in temperature and aquatic ecosystems in general, said Brian Menounos, a professor of Earth Sciences and Geography at the University of Northern B.C.

The Fraser Basin Council predicts that by the year 2100 a Fraser River flood would cost $32.7 billion to the economy, including an estimated $7.7 billion in interrupted cargo shipments, $7.6 billion in commercial damages and $6.6 billion in residential damages.The risk of flooding increases over the next 85 years.

Metro Vancouver's wettest days are going to become about 10 per cent wetter, Murdock said, This raises the risk of mudslides and flash flooding.

The number of days above 25 C in Metro Vancouver would roughly double, from 18 now to more than 30 per year in 2050. The City of Vancouver is likely to have about 30 days above 25 C. More inland parts of the region would likely see more, Murdock said. While more hot days might seem a welcome change for some, this also means more heat waves, which can be hard on the elderly and a greater strain on cooling and air-conditioning infrastructure.

Other impacts could include a growing season in the Lower Mainland expanded by more than two months and a 30-per-cent drop in frost days in the Okanagan, meaning the winters won't be cold enough to keep pests away.

In the Interior, the fire season could increase anywhere from 30 to 50 days.

With files from Johanna Wagstaffe and Polly Leger.

Monday, June 26, 2017

There's New Evidence Representing the Start of the Anthropocene


PROJECT EARTH

TIM RADFORD
6/12/17


Israeli researchers claim to have pinpointed the first permanent geological change made by humankind, the moment when humans first altered the planet’s geology.

They have identified a set of erosion processes made 11,500 years ago in the Dead Sea Basin. This would represent the first hint of what increasingly has been called the Anthropocene, a geological era in which the planet’s characteristics are defined by just one species, Homo sapiens.

The evidence comes from the Dead Sea Drilling Project, which provides a sedimentary record of the last 220,000 years. And the scientists have found that erosion rates in the Dead Sea Basin during the Neolithic were, they say, dramatically at odds with the known tectonic and climatic regimes of the period under review, less than 12,000 years ago.

“Human impact on the natural environment is now endangering the entire planet,” said Shmuel Marco, of the Tel Aviv University school of geosciences.
Agriculture’s mark

“It is therefore crucial to understand these fundamental processes. Our discovery provides a quantitative assessment for the commencement of significant human impact on the Earth’s geology and ecosystems.”

That is an academic’s way of conceding that the discovery is of only academic importance: archaeologists have known for more than a century that human civilisation began, roughly 12,000 years ago, in the Fertile Crescent with the end of the last Ice Age.

Stone Age nomad hunter-gatherers began to domesticate animals, cultivate grains and pulses and plant fruit trees and vines, and then build first small villages, and ultimately great ancient cities.

“Natural vegetation was replaced by crops, animals were domesticated, grazing reduced the natural plant cover, and deforestation provided more area for grazing,” said Professor Marco. “All these resulted in the intensified erosion of the surface and increased sedimentation, which we discovered in the Dead Sea core sample.”
Human footprint

The scientists report in the journal Global and Planetary Change that they measured a threefold increase in the fine sand carried into the Dead Sea by seasonal floods, and indicated changes in human activity that coincided with, and made possible, the exponential growth of humankind over the last 11,000 years.

The 100 centuries since the end of the last Ice Age have been known as the Holocene. Geologists argue that human-wrought change has altered the Earth so much that it warrants a new name: they propose a new epoch called the Anthropocene.

Humans have burned fossil fuels at such a rate that they could warm the planet to levels not seen for many millions of years. In doing so, they have altered the climate of the planet so dramatically that there is no fear of any return of the Ice Ages.

They have built, produced and destroyed on such a scale as to create a geological stratum that will survive as a permanent record of human existence long after Homo sapiens is extinct.

So the Dead Sea evidence is just an indicator of when the era of permanent change may be said to have begun: long before the first bronze or iron tools, humans made their mark with stone adzes, stone sickles and fire, and changed a landscape.

The sediments from the Dead Sea core have already evidenced periods of lush growth and extended drought, and serve as a reminder that the region is still affected by climate change.

Right now, the region is experiencing the worst drought in 900 years. Climate change could deliver even harsher things to come, according to a new study last year.

So the discovery by the Tel Aviv scientists represents a possible starting point: the story of human civilisation and human-induced climate change had a beginning that has now been identified in the sands of time 11 millennia ago at a depth of 457 metres under the Dead Sea.

The ending has yet to be written, but that too will be recorded, ultimately, in geological strata.

This story was originally published by Climate News Network.

Thursday, June 22, 2017

Eight views of Canada’s water woes

THE GLOBE AND MAIL

Jun 11, 2017

A comprehensive review of Canada’s freshwater ecosystems reveals rising threats from pollution, overuse, invasive species and climate change among other problems. Yet, the biggest threat of all may be a lack of information that hinders effective regulation, Ivan Semeniuk reports

With a mere 0.5 per cent of the world’s population, Canada has jurisdiction over 20 per cent of the global water supply – a vast and valuable resource that is largely taken for granted by those who depend on it.

Yet, according to the first national assessment of Canada’s freshwater ecosystems in decades, there is plenty of cause for concern. Each of the country’s 25 major watersheds is facing multiple environmental threats, while the data needed to track changes and guide policy makers are surprisingly inaccessible or simply non-existent.

“We don’t know the facts,” said David Miller, president of World Wildlife Fund-Canada, the environmental advocacy organization that conducted the assessment. “It’s a recipe for inaction.”

Mr. Miller added that spotty and unco-ordinated monitoring coupled with the widespread image of a pristine Canadian wilderness has left the country ill-prepared to track and respond to the growing pressures that its aquatic ecosystems are now facing.


Four years in the making, the assessment is intended to provide a national snapshot of the state of Canada’s water by assembling and comparing data on 167 subwatersheds. Because such information is neither centralized nor maintained in a systematic way, the organization had to search out scores of disconnected datasets from federal, provincial and municipal sources, water boards, conservation authorities and private companies. The result is a patchwork mosaic that reveals high levels of disturbance to water in about one-third of the subwatersheds, roughly corresponding to regions of highest population density, agricultural activity and resource development.


More surprising is a general lack of information on four key health indicators, including flow, water quality, fish and bottom-dwelling organisms that are sensitive to environmental change. The assessment finds that the data are too deficient in 110 out of the 167 subwatersheds to form a baseline picture of ecosystem health, including in some relatively populated areas where freshwater is essential to communities, such as in southern Manitoba, Nova Scotia’s Annapolis Valley or the Bruce region of Ontario.


The situation reflects the glaring absence of a standardized national water-monitoring program in a federal system where water has traditionally been regarded as a provincial or local matter. Yet, Canada’s watersheds are clearly interconnected and facing threats, from climate change to invasive species, that pay no regard to political boundaries. The assessment includes recommendations for filing in the knowledge gap including a community based “citizen science” approach to data gathering. Yet, it also makes clear that there is a clear need for co-ordination and oversight at a national level,


“If this can inspire the federal government to take a leadership role, that would be a good thing,” said Allen Curry, scientific director of the Fredericton-based Canadian Rivers Institute and an adviser on the project.


Canada’s balkanized water-management system makes it especially difficult to obtain data on freshwater that researchers say should be available to the public. Bureaucratic and proprietary barriers to access was the largest obstacle that the assessment’s authors faced in assembling their water report card.


“Despite living in the era of Google, we literally had to phone or e-mail or just beg people to send us data,” said Elizabeth Hendriks, who co-ordinated the WWF-Canada effort.


David Schindler, one of Canada’s most highly regarded freshwater scientists and a professor emeritus at the University of Alberta, said the assessment highlights the problems that stem from Canada’s lax regulation of its freshwater assets.


“We need standards, not guidelines, with some penalties for non-compliance,” he said.


Three years ago, Dr. Schindler was among the experts involved in a review of freshwater monitoring in the United States, a national program, managed by the U.S. Geological Survey, that he suggests Canada would do well to emulate. If things continue as they are, he said, freshwater ecosystems are likely to face unprecedented change while Canadians are left in the dark about what is happening to their country’s most important resource.


“Water – despite its theoretical abundance – is probably the biggest looming problem in Canada,” he said.


WATER COLOURS


A detailed breakdown of 167 subwatersheds reveals the environmental pressures that different parts of Canada’s water system face. Here’s what the indicators mean


Map legend


Table of contents


Overall stress level • Pollution • Alteration of water flow • Water use • Habitat loss • Fragmentation of ecosystems • Invasive species • Climate change

1. OVERALL STRESS LEVEL


The national assessment breaks Canada’s water system into 167 subwatersheds and finds that nearly all of them are currently the subject of some form of environmental disturbance, with multiple threats at play in some of the most affected regions. Areas at greatest risk tend to match up with population density, farming and heavy industry. Two regions – Eastern Lake Huron and the Lake Ontario and Niagara Peninsula subwatershed – share the dubious distinction of being the most disturbed in Canada because of a combination of seven threat factors, including high pollution levels, water use and fragmentation, among others shown in the accompanying maps.


(Return to map legend)

2. POLLUTION


Pollution remains the most serious threat to freshwater in the short term. The assessment combines data on a variety of pollution sources to reveal a high degree of stress across nearly the full length of Canada’s southern border. In many regions, point source pollution including wastewater effluents, industrial discharges and urban runoff are the largest contributors while agricultural contamination, including nitrogen, phosphorus and pesticides, dominates in the Prairies and Southwestern Ontario. Two other sources – pipeline incident and pollution from transportation mishaps – mainly account for why the zone of very high stress reaches up into northern Alberta.


(Return to map legend)

3. ALTERATION OF WATER FLOW


Large dams and reservoirs serve to disrupt the flooding cycles and variations in flow levels that are natural to all river systems. Among the 12 subwatersheds with very high alteration of flows is the Churchill River in Labrador, where the Muskrat Falls hydroelectric megaproject is located. Another is the La Grande subwatershed in Quebec, home to the largest hydroelectric station in Canada. While the majority of Canada’s northern river systems are currently unaltered by dams, the picture could change dramatically in the future because of the central role hydroelectric power development is expected to play in helping Canada meet its greenhouse gas emission targets.


(Return to map legend)

4. WATER USE


Most of Canada has not seen the removal of vast quantities of freshwater from ecosystems for agricultural production and other uses. But in 17 subwatersheds, the threat posed by the overuse of water is high or very high. These are located in prime agricultural land along the South Saskatchewan and Assiniboine-Red River systems and in the Great Lakes and St. Lawrence regions. Many are part of the boundary waters that Canada shares with the United States. The analysis also includes water intake for drinking water, manufacturing and mining but not the oil and gas industry.


(Return to map legend)

5. HABITAT LOSS


The assessment shows a significant loss of ecosystems in more than half of Canada’s 167 subwatersheds. In the southern part of the country, the decline is mainly due to conversion of natural landscapes into farmland while in a broad swath of the north, from the Yukon to central Quebec, the main driver of habitat loss is forestry. In residential areas, impervious, artificial surfaces such as paved roads, driveways, parking lots and rooftops disrupt natural habitats while increasing the runoff of pollutants into watersheds.


(Return to map legend)

6. FRAGMENTATION OF ECOSYSTEMS


In addition to habitat loss, structures such as dams, roads and railways serve to divide freshwater ecosystems, impede migration of fish and other species, and alter the flow of nutrients. The negative results includes a loss of genetic diversity in aquatic species. A total of 61 subwatersheds, mostly in southern Canada where roads are most numerous, show a very high loss of connectedness. In the North, logging and mining roads are the primary causes of fragmentation.


(Return to map legend)

7. INVASIVE SPECIES


A growing influx of invasive plants and animals has reduced biodiversity and changed the balance of ecological communities in a number of subwatersheds, most notably in Southwestern Ontario where native species are already under high stress due to other risk factors. This threat was among the more challenging of the seven to measure because it is easier to demonstrate the presence rather than the absence of a species that is not native. The threat level only indicates invasive species that are already known to be present in a given watershed, not those that pose likely future threats, such as Asian Carp in the Great Lakes.


(Return to map legend)

8. CLIMATE CHANGE


While climate change currently presents a low or moderate risk across most of Canada today, it is the stressor that is most likely to play a major role in watershed health in the future. Climate projections include more frequent extreme weather events such as flooding and severe droughts that will further tax water systems. More broadly, even small shifts in temperature and precipitation can translate into profound effects on flow rates and on the way ecosystems function. In terms of watershed health, climate change is expected to become important as an amplifier of other threats.


(Return to map legend)


CANADA’S WATER: MORE FROM THE GLOBE AND MAIL


Saturday, June 17, 2017

What if several of the world’s biggest food crops failed at the same time?

Anthony Janetos
Jun 11, 2017


Many of the world’s major breadbaskets have experienced crop loss due to climate change


(Credit: Getty/JamesBrey)


This article was originally published on The Conversation.

Less than one-quarter of Earth’s total cropland produces nearly three-quarters of the staple crops that feed the world’s population – especially corn, wheat and rice, the most important cereal crops. These areas are our planet’s major breadbaskets.

Historically, when a crop failed in one of these breadbaskets, only nearby areas had to contend with shortages and rising prices. Now, however, major crops are traded on global markets, which means that production failures can have far-reaching impacts. Moreover, climate change is expected to generate heat waves and drought that could cause crop losses in most of the world’s breadbaskets. Indeed, failures could occur simultaneously in several of these key regions.

Pardee Center postdoctoral scholar John Patrick Connors and I are using mathematical models to study the potential environmental and economic impacts of failures in multiple breadbaskets around the world. It is already clear from our preliminary work that this is a real, near-term threat.

The good news is that not all of these regions respond in the same way to shocks in other places in the world. Some could bring new land into production quickly, easing stresses caused by crop failures elsewhere. But in order to make global food systems more robust, we need to know more about the most damaging consequences of multiple breadbasket failures.

A vulnerable system

In the past several decades, many of the world’s major breadbaskets have experienced shocks — events that caused large, rapid drops in food production. For example, regional droughts and heat waves in the Ukraine and Russia in 2007 and then again in 2009 damaged wheat crops and caused global wheat prices to spike by substantial amounts in both years. In 2012 heat and drought in the United States slashed national corn, soybean and other crop yields by up to 27 percent. And yields of important food crops are low and stagnating in many countries due to factors including plant diseases, poor soil quality, poor management practices and damage from air pollution.


At the same time, many experts assert that world food production may have to double by 2050 to feed a growing population and satisfy rising demand for meat, poultry and dairy products in developing countries. Global agricultural production has risen over the past 50 years, largely fueled by improvements in plant breeding and more intensive use of inputs, such as mechanized equipment, fertilizers and pesticides. This trend has eased pressure to bring new land into production. But it has limits, especially in the developing world, where the need to produce more food has been a main driver of deforestation in recent decades.

It is clear that rising demand, growing international trade in agricultural products, and the potential for weather-, climate- and soil-related shocks are making the world food production system less resilient. Global agricultural trade can mean that price spikes in one region, if they are severe enough, can be felt broadly in other regions. Minor shocks, on the other hand, could be lessened by trade and by using grain reserves.

There is increasing evidence that in very poor countries, food price increases and shortages can lead to civil unrest and worsen other social and political stresses. And more wealthy countries are not immune, given the concentration of world food production and the global nature of trade. For example, the Russian/Ukrainian heat wave referenced above led to spikes in food prices, not just in the price of wheat. However, more wealthy countries also typically have more ability to buffer price shocks by either using grain reserves or increasing trade.

Modeling potential shocks

How can we understand this risk and its potential consequences for both rich and poor nations? Programs already exist to provide early warning of potential famines in the world’s poorest countries, many of which already depend heavily on food aid. There also are programs in wealthier nations that monitor food prices and provide early warnings of price spikes.

But these programs focus mainly on regional risks, and often are not located in major food production areas. Very little work has been done to analyze risks of simultaneous shocks in several of the world’s breadbaskets.

We want to understand the impacts that shock events could have if they occur in the real world so that we can identify possible contingency plans for the largest-impact events. In order to do that, we have used an integrated assessment model, the Global Change Assessment Model, which was developed by the U.S. Department of Energy and is freely available to users around the world. Integrated assessment models have been designed specifically to simulate the interactions among Earth’s energy, economic and land use systems.

We have developed scenarios in which small shocks (10 percent crop loss) and large shocks (50 percent crop loss), averaged over five years, are applied to corn, wheat or rice in their major production regions, and then to all the combinations of one, two or all three crops in one, two or the top three production regions.

Unsurprisingly, our results to date suggest that large shocks have larger effects than smaller shocks, as measured in subsequent changes in land use, the total amount of land dedicated to agriculture and food prices. But more interestingly, not all breadbasket regions respond to shocks in the same way.

Some of these areas are quite unresponsive to shocks occurring elsewhere in the world. For example, the total amount of land in agricultural production in South Asia changes relatively little due to shocks elsewhere in the world, largely because most of the arable land is already in use.

But other regions are extremely responsive. Notably, Brazil has the ability to bring a lot of new land into production if large shocks occur elsewhere, because it still has a significant amount of potentially arable land that is not currently being farmed. However, this land currently is mostly forest, so clearing it for agriculture would add significantly to atmospheric concentrations of carbon dioxide, and thus to global climate change.

Mapping risks

The Pardee Center has published a research agenda that discusses what we still need to know about these risks. Key questions include understanding the full distribution of risks, whether increased international trade can ameliorate risk and where the most responsive and the most sensitive regions are.

Ultimately, understanding and preparing for multiple breadbasket failures will require input from climate scientists, agronomists, ecologists, remote sensing experts, economists, political scientists and decision-makers. Mounting such an effort will be challenging, but the costs of failing to do it could be devastating.

Anthony Janetos, Director, Frederick S. Pardee Center for the Study of the Longer-Range Future and Professor of Earth and Environment, Boston University

Wednesday, June 14, 2017

Security Experts Identify 12 Likely Triggers of War as the Planet Warms


Lorraine Chow

09 June

Security Experts Identify 12 Likely Triggers of War as the Planet Warms

Climate change isn't just causing glaciers to melt, sea levels to rise and forests to set fire. It has becoming increasingly evident that Earth's rising temperatures also threatens international security.


In fact, an analysis released Friday by the Center for Climate and Security has identified 12 "epicenters," or categories, where the world's rising temperatures could trigger major global conflict.

"Any one of the climate and security epicenters can be disruptive," said Caitlin Werrell, co-president of the Center for Climate and Security and editor of the report, Epicenters of Climate and Security: The New Geostrategic Landscape of the Anthropocene. "Taken together, however, these epicenters can present a serious challenge to international security as we understand it."

The categories include eroding state sovereignty, low-lying nations going underwater, as well as the disruption in the global coffee trade that employs 125 million people worldwide.

Previous studies have identified how terrorist groups in certain regions are taking advantage of increasingly scarce natural resources such as water and food as a "weapon of war." Additionally, a U.S. military report from 2014 called climate change a "catalyst for conflict" and a "threat multiplier." President Obama once said that "no challenge poses a great threat than climate change, and it's an "immediate risk to our national security."

Meanwhile, President Trump and many top officials in his administration brush off or reject the science of climate change. Conservative media has also mocked the idea that climate change is related to the growth of terrorism. And let's not forget Trump's middle finger to the world when he dropped the U.S. out of the Paris climate agreement, which has been signed by every nation on Earth except war-torn Syria and Nicaragua, which didn't think the accord was strong enough.

The Center for Climate and Security report stresses why mitigating climate change should be the highest priority for governments and institutions around the world.

"This report demonstrates the kind of cross-sectorial thinking needed to anticipate and mitigate climate-related systemic risks—risks that will be disruptive at local, national, regional and global levels," said Francesco Femia, co-president of the Center for Climate and Security and editor of the report. "Security risks thousands of miles away can have an effect on us at home. Understanding that can help advance preventive rather than reactive solutions."

These are the 12 epicenters identified by the security experts in the report:

1. Eroding State Sovereignty: An inability to absorb the stresses of a rapidly-changing climate may erode state sovereignty (Francesco Femia and Caitlin Werrell);

2. Disappearing Nations: Many low-lying nations are in danger of being completely submerged by rising seas (Andrew Holland and Esther Babson);

3. Conflict Over Melting Water Towers: Climate change can increase tensions and conflict among the 4 billion people dependent on mountain “water towers" (Troy Sternberg);

4. Conflict Over Fisheries: A warming ocean is driving critical fish stocks into contested waters, contributing to conflict between states (Michael Thomas);

5. Tensions in a Melting Arctic: Increased activity in a melting Arctic raises new security and geopolitical risks (Katarzyna Zysk and David Titley);

6. Weaponized Water: As climate change exacerbates water stress, non-state actors, including international terrorist organizations, are increasingly using water as a weapon (Marcus King and Julia Burnell);

7. Disrupted Strategic Trade Routes: Climate change will place strains on maritime straits that are critical for global trade and security (Adam H. Goldstein and Constantine Samaras);

8. Compromised Coffee Trade: Climate change may also disrupt critical global trading networks, like the coffee trade. which currently supports 125 million people worldwide (Shiloh Fetzek);

9. More (and Worse) Pandemics: Climate change may increase the likelihood and range of pandemics, which could threaten global security (Kaleem Hawa);

10. Flooded Coastal Megacities: Rapidly expanding coastal megacities are threatened by climate impacts like sea level rise, which can destabilize nations (Janani Vivekenanda and Neil Bhatiya);

11. Increased Displacement and Migration: Climate change is becoming a more significant driver of migration and displacement (Robert McLeman);

12. Enhanced Nuclear Risks: Climate change, nuclear security, and policies that are not sensitive to both simultaneously, can increase regional and global security threats (Christine Parthemore)

Here is a video introduction to the report:

Sunday, May 14, 2017

The CBC documentary every non-indigenous Canadian needs to watch


Amanda Siebert
CBC
January 27th, 2017


COLONIZATION ROAD, CBC

With Canada's 150th anniversary and its outrageous $500,000,000 price tag garnering attention nationwide, massive Canada Day parties are being planned from Vancouver to Halifax.

But many have raised questions of how the federal government can justify such spending when atrocities like the ones listed below are taking place on First Nations reserves throughout the country:
A number of reserves are being affected by an overwhelming rate of child suicide. These reserves include Deschambault Lake, Attawapiskat, and Wapekeka. Despite numerous requests for funding and additional on-reserve health care services, most have been denied.

As of October 31, 2016, there were 133 boil water advisories in 90 First Nations communities across Canada. (Think about that one next time you grab a drink from the tap.)

The Grassy Narrows First Nation in Ontario is currently so contaminated with mercury that levels detected in soil there are 80 times what is expected in the rest of the province.

(A provincial environment minister called for a clean-up as early as 1984, but was ignored by governments at all levels.)

A federal inquiry into more than 1,200 missing and murdered Indigenous women is frustrating families because of the government's lack of consultation. The Native Women's Association of Canada has given it a failing grade for its slow progression.

Children living on First Nations reserves are chronically underfunded when compared to children living off-reserve.

This was made all the more clear a year ago when the Canadian Human Rights Tribunal found that the government discriminates against First Nations children on reserves. Prime Minister Trudeau made promises of funding, but has yet to fulfill them.

Critic and executive director of the First Nations Child and Family Caring Society of Canada Cindy Blackstock says the federal government must step up with $155 million for child welfare, "to give these kids a fighting chance to grow up in the families."

Indigenous people make up nearly one quarter of the federal inmate population. Nearly half of the children in Canada's foster care system are indigenous. (Keep in mind that only four percent of Canada's population is indigenous.)

Concerns regarding energy projects like the Site C Dam, the TransMountain Pipeline, the Keystone XL pipeline, the Alberta oil sands, and other resource-based projects brought forward by First Nations are largely ignored by governments at provincial and federal levels.

(Not to mention the ongoing dismissal of most requests made by First Nations communities of the government to uphold established treaty rights.)

Overall, indigenous people in Canada make less income, face higher unemployment rates, higher rates of suicide, higher rates of death among children, higher rates of incarceration, inadequate housing, and poorer health than the average Canadian settler.

This is just the tip of the iceberg, but also my way of telling you (yes, I'm telling you) to educate yourself about why Canada's First Nations, both on reserve and off, face hardship at a level few non-indigenous Canadians could even imagine.

In 2009 at the G20 summit in Pittsburgh, then-Prime Minister Stephen Harper declared to the world that Canada, "has no history of colonization." Eight years later, CBC has proved him wrong with a documentary called Colonization Road.

Airing for the first time yesterday, the documentary is hosted by Ryan McMahon, an Anishnaabe comedian hailing from the Koocheching First Nation in northwestern Ontario.

In it, McMahon takes viewers through a history lesson they undoubtedly never received in school: how the building of colonization roads post-contact destroyed First Nations communities.

Featuring notable indigenous scholars, researchers, and academics, including Pam Palmater, Al Hunter, Leanne Betasamosake Simpson, and Lee Maracle among others, Colonization Road speaks to issues that will probably make fragile settlers feel uncomfortable. As it should.

"I think the problem is the relationship.... Reconciliation is us [First Nations] forgiving them [the government]. Well, I would forgive anybody for standing on my feet, if they fucking got off," Maracle says near the end of the documentary.

"It doesn't end. They agreed that they separated us from our teachings; they agreed that they separated us from our language, and thus the language was pretty much destroyed in ourselves; they agreed they separated us from our culture, and so we're culturally fractured, and destitute, but nobody's going to help us bring it back together.

"They're still educating us in their schools, in their culture, in their language. It's still going on. They are still on our feet."

Watch the documentary on CBC here.

Follow Amanda Siebert on Twitter and Facebook.

Thursday, May 4, 2017

Why we tend to ignore climate change

Our preoccupation with "Presentism" leads us to ignore climate change as it is not of immediate concern, Emma Teitel says.

Kaskawulsh Glacier in the Yukon has been melting much faster than anywhere else in the world, but people seem more interested the day to day issues that surround us, Emma Teitel says. (CANADIAN HERITAGE GALLERY)

EMMA TEITEL
National Columnist
Star Columnist
Fri., April 21, 2017


For the first time in modern history, a river changed direction almost overnight. This happened not by the awesome hand of God (or the wooden staff of Charlton Heston), but by the perfectly ordinary human hand of climate change.

In more scientific terms, news emerged this week that the gigantic Kaskawulsh Glacier in the Yukon receded so extensively, its “meltwater” actually changed course. As a result, it is now flowing into an entirely different body of water. The scientists who made this discovery last summer call the water-rerouting phenomenon, “River Piracy.”

River Piracy: it sounds like a really bad indie rock band listed in fine print at the bottom of a Coachella poster. Unfortunately for Planet Earth, it’s an adverse environmental event of biblical proportions — an event that highlights just how suddenly and significantly climate change can impact the world — and even more troubling, an event that is likely the consequence of human behaviour.

In other words, it’s big news. Big, bad news. Yet it doesn’t feel like it at all.

Why is this? Because even though climate change is a problem routinely dubbed “The Issue of Our Time” by scientists, journalists and world leaders, it also happens to be an issue we appear to know and care very little about. A river suddenly changing course for the first time in modern history is news that should provoke the kind of fiery Facebook rhetoric and debate that follows a Donald Trump Twitter tirade, but it doesn’t. Instead, it falls as flat as an arctic plain.


I’m not judging anybody here. I am just as guilty of ignoring The Issue of Our Time as the next person who absent-mindedly throws her apple core in the garbage can. The first time I read about the receding Kaskawulsh Glacier, I abandoned the story halfway through when my eyes caught another breaking news alert: “Prince Harry Reveals He Sought Counselling in Aftermath of Princess Diana’s Death.” If only Prince Harry lived at the bottom of a melting glacier. Perhaps we’d take a greater interest in the planet’s health if it were bound up in the health of the royal family.

Alas it is not. So, research shows, we keep on ignoring a global problem we deem too big and confusing to curtail. But why do we do this even in the face of disturbing environmental events? And what will it take to get us fired up about something called River Piracy? American social psychologist David Dunning says the prevailing barrier to mass interest in climate change is “Presentism,” i.e. a preoccupation with the present moment.

“The major human tendency that often seems to be in play,” Dunning says, “is that people are much more interested in what’s happening now — today. Things that are more far off in the future, people have a harder time getting motivated about.”

Per Espen Stoknes, a Norwegian organizational psychologist who wrote a book about climate change apathy called What We Think About When We Try Not To Think About Global Warming, is of a similar mind.

“Global warming feels distant in time: the years given — 2050 and beyond, seem very far away,” Stoknes says. Climate change is also, for the most part, invisible to the average human being: “CO2 is colourless and odourless. If CO2 was a black ooze, we’d have solved it a long time ago.”

Glaciers may be melting right now, in present time, and sea levels might be rising in places like Florida and Bangladesh, but the end result — i.e. the cinematic catastrophe everyone fears — when the planet warms over and society collapses — isn’t projected to take place for decades. The general consensus then among regular people seems to be: “What’s one more runny ice block in the interim?”

Perhaps what’s needed in the quest to get society to care about something that won’t cause it massive grief for years to come is a universal rejection of “Presentism.” Dunning and Stoknes are right: we love the present. But not only do we love the present, we live in a culture that has a near pathological obsession with it. The cult of mindfulness, living in the moment, YOLO-ing, dispelling negative thoughts in favour of Good Vibes Only: this is our secular religion. It’s a religion that actively campaigns against thinking too much and too hard about what lies ahead.

And while this religion is a friend to the individual — especially the individual who’s just returned from a hard day’s work and would rather read about Prince Harry than River Piracy — it’s the enemy of long-term critical thinking and long-term change. Until we ditch the power of now, we’ll continue to live in the moment at the expense of the future.