Visitors

Friday, December 30, 2016

Dispelling myths around the Arctic Circle’s famed ‘doomsday’ seed vault


Located not far from the North Pole on the island of Spitsbergen, the Svalbard Global Seed Vault safeguards the agricultural plant collections of more than 230 countries. (Mari Tefre/Prospecta Press)


The Svalbard Global Seed Vault is not exactly at the North Pole, but it’s nearer to it than just aboutanywhere else, and well inside the Arctic Circle on the Norwegian archipelago of Svalbard. This beguiling structure juts out from a mountain near the town of Longyearbyen, which is reputed to be the northernmost permanent settlement on Earth and a place where residents must go about their business with rifles slung over their backs, on account of the polar bears. The sun falls below the horizon on Nov. 14 and isn’t seen again until March 8.

It is precisely this remoteness and coldness that led scientist Cary Fowler and his colleagues at the Global Crop Diversity Trust, now known as the Crop Trust, to persuade the Norwegian government to locate the vault there. Almost nine years after it was built, the seed vault has taken on a mythic quality around the world, perhaps because its entrance — stark, geometric, bejeweled by a light sculpture by Norwegian artist Dyveke Sanne — hints at something not just hidden but forbidden. Bauhaus meets Valhalla.

Fowler, with principal photographer Mari Tefre, has just written a book on the vault that lifts the veil on the place — it’s not open to the public even though it quickly became the second most recognized structure in Norway. The book is called “Seeds on Ice,” and if you’re still looking for a gift for the gardener or gourmet in your life, this would work handsomely.

Svalbard’s beguiling paradox of fame and mystery inevitably has spawned various wacky conspiracy theories, including the idea that the vault is a top-secret NATO facility housing a global eugenics project. Fowler hopes the book will dispel a more mainstream misapprehension: that this is a doomsday vault, a time capsule to unlock after a nuclear Armageddon.


Cary Fowler in the main seed vault. Its natural year-round temperature is minus-5 degrees Celsius (23 degrees Fahrenheit), but the air is further cooled to the optimum storage temperature of minus-18 degrees Celsius (zero degrees F). (Jim Richardson/Prospecta Press)


The vault today houses more than half a billion seeds representing 881,473 unique varieties of plants used to feed people. The seeds come from the existing seed banks in 233 countries, and they are insurance against the loss of an irreplaceable crop to something as unexciting as a budget crisis in a poor country (or a rich one) to, yes, a cataclysmic nuclear war.

Each seed has its own genetic makeup, and the value of these stocks is in their DNA. If a new disease or pest were to wipe out a strain of wheat, for example, it’s probable that the germ plasm at Svalbard could be used to breed in resistance. Climate change poses another tangible threat, as extreme weather events, rising waters and shifts in temperatures require the development of new varieties to handle the challenges.

In part, the Svalbard vault is best understood by what it is not: It is not a vast subterranean laboratory staffed with the world’s boffins in white coats, a la CERN or a James Bond movie. It is a hole in a mountain, a tunnel that extends a few hundred feet and terminates in three chambers, each 90 feet long, 30 feet wide and 16 feet high. Only one is in use at the moment.

It is simple, relatively cheap to run, and designed to withstand physical calamity and human interference. It is meant to last a thousand years or more.

It is not permanently staffed, though it is constantly monitored and the seeds are housed behind at least five locked doors. You couldn’t just show up and loiter with intent. You would be noticed by the local police, or the controllers in the distant airport tower or the polar bears.

Nor is it a time capsule. The seeds are very much alive and available for use today, if needed.

Unfortunately, that has come to pass with the tragedy that has befallen Aleppo. The Syrian city held the seed bank of the International Center for Agricultural Research in the Dry Areas (ICARDA) and contained vital stocks of such staples as wheat, barley, chickpeas and fava beans.

The staff there sent seeds to Svalbard just months before the engulfing civil war. Last year, Svalbard returned many of the seeds to new ICARDA facilities established in Morocco and Lebanon, where scientists and farmers are now growing them to regenerate seed.

The threats to our food supply are often far less stark but no less real. Fowler says agriculture faces “its most severe set of challenges since the Neolithic period.” Besides climate change, this includes the need to grow more food for an increasing population using fewer resources. One contemporary approach to this is the development of genetically modified organisms by multinational biotech companies. The vault doesn’t contain GMOs, though Fowler’s stance on this is not strictly in opposition to transgenic breeding. His interest, instead, is in conserving all the natural genetic diversity embodied in these seeds as insurance for our food supply in the centuries to come.

In the early ’90s, Fowler, a native Tennessean, was recruited by the U.N.’s Food and Agriculture Organization to oversee a review of the world’s crop diversity and found many national seed collections in dire states of storage and care. He has since left the directorship of the Global Crop Diversity Trust, though he remains an adviser to the trust and is chair of the seed vault’s International Advisory Council.

He says the Svalbard vault could bring a more rational system of seed conservation to seed banks around the world by relieving some of the pressure on national collections and the resources needed to maintain them.

Fowler has been immersed in this field for decades, but Svalbard made him realize, he said, that many of the world’s agricultural crops are not familiar even to experts. What, you might ask, is sesbania, or Chihuahuan snout-bean or voa vanga?

The point is that tastes and crops change — how many gardeners in the United States were growing bok choy or arugula 50 years ago? “People look at the seed vault and see it as a conservation initiative,” he told me. “But those of us in the field have multiple motivations. The reason for wanting to conserve it isn’t to make us feel good but have it be of use in the future.”

Like the crystalline, fiber-optic sculpture at its portal, the vault is a beacon of optimism and comity in a world that may seem cold and dark. It is a gift to the entire human family for generations to come. Santa, an Arctic neighbor, no doubt would approve.


Tuesday, December 27, 2016

The Best Maps of 2016

National Geographic
Greg Miller/Dec 19, 2016


From the craters of Mars to the streets of Zurich, these maps show cartography at its best.


This map comes from that traced the route of two men who attempted to hike the length of the Grand Canyon in 2015—an 800-mile trek completed by fewer than two dozen people. Cartographer Charles Preppernau led a team that created a 3D digital rendering of the canyon.Then, they meticulously adjusted the lighting and color to maximize the sense of depth. Even the simulated snow (seen above) was carefully added in places where real snow would accumulate. “We really wanted to showcase the terrain of the canyon,” Preppernau says.

Map by Charles Preppernau, National Geographic


The Swiss national mapping agency, swisstopo, is renowned for maps that make the country’s mountainous terrain pop off the page. This year the agency has been , making its renderings of the entire country—including cities like Zurich, above—easier to read and more striking than ever.


The screenshot above comes from an —created by three students at the University of Wisconsin, Madison—that explores the maritime world of the colonial era. The students compiled historical records of sea travel from 1750 to 1850, then created an interface that lets users select a colonial power—British, French, Dutch or Spanish—and see where their ships roamed. Users can also examine wind patterns, weather reports, and notes from the captains’ logs.
Map by , , and


GPS and other technological advances are allowing scientists to track wild animals in more detail than ever before. Geographer James Cheshire and designer Oliver Uberti of animal tracking data for their book, Where the Animals Go, published this year. The map above charts the wanderings of a single elephant seal in the Southern Ocean.


Map by Mapping Inequality


It’s been a good year for map lovers. Whether you’re into old maps, new maps, or new ways of interacting with old maps, there was much to cheer about in 2016.


Lots of great historical maps became more accessible this year. One of the world’s great private map collections is now open to the public at Stanford University. The Central Intelligence Agency, which isn’t exactly known for sharing, released a slew of historical maps to celebrate the 75th anniversary of its Cartography Center. Here at All Over the Map, we were excited to publish a few maps that haven’t been readily available online, including secret Japanese military maps and a map used in 1783 at the Treaty of Paris to negotiate the borders of the brand-new United States of America.


It’s nearly impossible to keep up with all the innovative and beautifully designed maps being made these days. And thanks to the proliferation of digital cartography tools, lots of non-cartographers are making maps now too. This year, scientists mapped the rise of “megaregions”—clusters of interconnected cities—and documented the increasingly fragmented areas of Earth that can’t be reached by road. Journalists got into the act too, making sophisticated and attractive maps to examine everything from the presidential election to the aerial surveillance of U.S. cities.


Cartography may be in the midst of a digital revolution, but if you think hand-drawn maps have no place in the modern world, consider the case of the tourist who, earlier this year, wanted to mail a card to a small family farm in Iceland but didn’t know the address. He drew a map on the envelope instead, and it still found its intended destination—proof, if you really needed it, of the power of maps.

Friday, December 23, 2016

‘Up Side Down’ map quiz puts your geography skills to the test

Curbed
Barbara Eldredge/Dec 21, 2016


See cities, countries, and lakes as you’ve never seen them before


Pentagram


Mapping is more than a handy reference tool: It’s a powerful technique to understand the world. But few people recognize the assumptions and Euro-centric conventions inherent in typical renderings of the earth. As a new project from Pentagram partner Angus Hyland illustrates, “up” is arbitrary for our spherical world.


Last year, Hyland designed a beautiful, “upside down” world map for the company holiday card. This year, he’s transformed it into a booklet and interactive geography quiz you can play online.


Players are asked to identify cities, countries, and lakes from unconventional perspectives or entirely removed from their typical context. Even for avid geography nerds, picking out Japan in a trio of topsy-turvy archipelagos is a mental workout.


Flipping our mental models of countries and continents also underscores an important point. As Pentagram writes on its blog: “This simple act questioned the orthodoxy of the world map; itself a consequence of European explorers eager to place themselves at the centre of the earth.” Give it a whirl here.


Via: Co.Design, Pentagram

Wednesday, December 21, 2016

Plate tectonics shift?

Olivine provides new data set for understanding plate tectonics

December 15, 2016
Geology Page

Shown is a typical rock outcrop of peridotite, which contains a series of melt veins, the slightly green horizontal bands running across the rock. Credit: University of Delaware
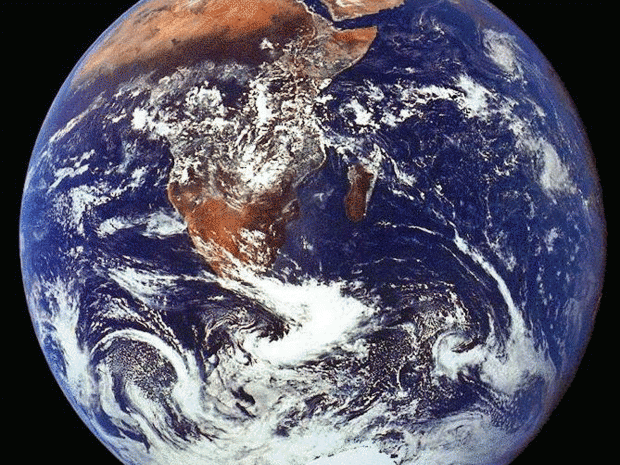
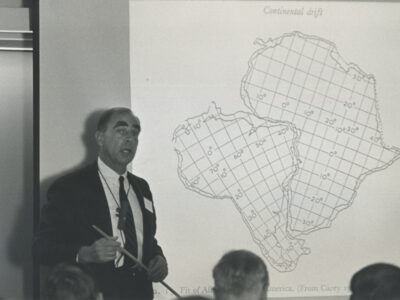
Plate tectonics, the idea that the surface of the Earth is made up of plates that move apart and come back together, has been used to explain the locations of volcanoes and earthquakes since the 1960s.

One well-known example of this is the Pacific Ring of Fire, a 25,000-mile stretch of the Pacific Ocean known for its string of underwater volcanoes (nearly 450 of them) and earthquake sites, according to the National Oceanic and Atmospheric Administration (NOAA).


On the Pacific Coast, this area sits along the subduction zone known as the Cascadia plate, which runs down the west coast of Canada to the west coast of the United States. Most earthquakes are said to occur at subduction zones or along faults in tectonic plates.

What actually defines a tectonic plate and how thick plates are, however, has remained a hotly debated topic. This is because while scientists know that the top of the plate is the surface of the Earth, defining the plate’s bottom boundary has been challenging.

A recent study by the University of Delaware’s Jessica Warren and colleagues at the University of Oxford and the University of Minnesota, Twin Cities, provides a new data set that scientists can use to understand this problem.

“Understanding the thickness of the plate is important to understanding how plates move around, both when they form at mid-ocean ridges and later on when the material goes back down into the Earth through subduction zones such as those in Cascadia, the Andes, Japan and Indonesia,” said Warren, assistant professor in the Department of Geological Sciences in the College of Earth, Ocean, and Environment.

“It also can help scientists model and predict future earthquake and volcanic hazards, where they might occur and how deep the devastation might be depending on what the models show.”
Olivine a robust model of Earth’s interior

To understand what’s happening inside the Earth, scientists must be creative because studying the interior of the Earth in situ is impossible.

Instead, scientists study how seismic waves pass through the Earth and then invert the signal that is received to reverse engineer what’s happening. They also model the thermal properties of the rock, including where temperature changes occur, because they know that the interior of the Earth is hotter than the surface crust.

“Science has been telling us that what we predict for temperature changes within the Earth should agree with what the seismic waves are telling us. The problem has been that these two models don’t agree,” said Warren, a petrology expert who studies the origin of rocks and how they formed.

One longstanding argument has been whether the Gutenberg discontinuity — the identification of a change in seismic properties — represents the bottom of the plate.

To investigate this problem, Warren and her colleagues performed laboratory experiments on olivine, the main mineral found in the Earth’s mantle (the upper ~250 miles of the planet). Olivine also is the main mineral in peridotite rock, which is considered to be a robust model of the interior of the Earth’s composition.

The researchers took olivine and added melt (also known as basalt) to mimic how a new plate is created at a mid-ocean ridge. The team then twisted the olivine-melt mixture under high temperatures and high pressure to determine the influence of melt on the alignment of olivine crystals. They then used these experiments to predict the seismic signature of this rock and compared it to the seismic signature associated with the Gutenberg discontinuity.

The team’s results showed that the Gutenberg discontinuity does not define the bottom of the plate, but instead is caused by the presence of olivine-melt mixtures within tectonic plates.

“I’ve spent over a decade studying how olivine minerals are oriented in peridotite rocks because the flow patterns provide a historical record of how these rocks from the mantle have changed and deformed over time,” says Warren.

The research team’s results suggest the best way to model the plate thickness is based on the thermal profile and the conductive cooling that occurs as a plate ages.

“We think that the bottom of the plate is below where you have a cooling in the temperature profile. It is a layer that is associated with melt being trapped or frozen in the rock and changing the seismic properties in the rock that subsequently produced the layer that we’re imaging,” she said. “By our estimates, this would mean that the tectonic plates in the ocean are approximately 100 kilometers or about 62 miles thick. ”

The team’s data also offers an explanation for the Guttenberg discontinuity, Warren continued, saying that it corresponds to melt that was trapped or frozen in the rock after melting at mid-ocean ridges, which produced a change in how the seismic waves pass through the rock.

Reference:
Lars N. Hansen, Chao Qi, Jessica M. Warren. Olivine anisotropy suggests Gutenberg discontinuity is not the base of the lithosphere. Proceedings of the National Academy of Sciences, 2016; 113 (38): 10503 DOI: 10.1073/pnas.1608269113

Note: The above post is reprinted from materials provided by University of Delaware.

Read more : http://www.geologypage.com/2016/12/plate-tectonics-shift.html#ixzz4TIXe2ZGu
Follow us: @geologypage on Twitter | geologypage on Facebook

Tuesday, December 20, 2016

How to stop the sixth mass extinction

By John D. Sutter, CNN/Dec 11, 2016

Scientists warn the Earth is entering the sixth mass extinction. Three quarters of all species could vanish.

Listening for extinction: the amphibian apocalypse

Iconic African elephant population on the brink
If coral reefs disappear, so will they
The old man and the bee
The birds on this island eat plastic


(CNN) — The Earth is on the verge of a mass extinction event.
To understand how big of a deal that is you don't have to look much further than the definition of "mass extinction." It means that three-quarters of all species vanish -- forever.

In all of history, that's happened only five times.

The sixth extinction would be the first caused by humans.

"We are basically annihilating the life on our planet -- and that is the only known life ... in the entire universe," said Paul Ehrlich, Bing professor of population studies at Stanford University.

"It's life that shaped the planet, that made it possible for us to live here. It's life that still makes it possible for us to live here. (If) we don't have the diversity of other organisms, we're done."

I've been reporting on the coming extinction crisis this year for a CNN series called "Vanishing." And I can tell you that while this topic is enormously depressing, there is some good news: We know how to slow or hopefully stop the sixth extinction.

Anthony Barnosky, another extinction expert, also from Stanford, told me humans have at most 20 years to make sweeping changes about our relationship with nature. If we do that, he said, we can avoid the sixth extinction.

But here's what needs to happen, according to the experts.

1. STOP BURNING FOSSIL FUELS

Burning fossil fuels and chopping down rainforests is heating up the atmosphere. That's creating trouble for all corners of the natural world, from the Rocky Mountains, where the tiny pika is overheating, to the oceans, where coral reefs are being decimated as the oceans warm and become more acidic.

We know that to avert the worst of climate change we need to limit warming to at most 2 degrees Celsius. To do that, the world needs to be off fossil fuels this century -- hopefully closer to 2030 than 2100. That's a tall order, but Stanford University researchers have shown we can do it with existing technology like wind, solar and nuclear.

Policies that promote cleaner energy include carbon taxes, cap-and-trade pollution pricing systems and renewable energy tax credits. The Paris Agreement on climate change, ratified by the United States and 115 other countries, also creates a framework for a rapid shift away from fossil fuels. The Trump administration in the United States, however, threatens to move the world's second-biggest climate polluter away from that agreement and back towards dirty, climate-warming fuels.

2. PROTECT HALF THE EARTH'S LAND -- AND OCEANS

This idea comes from renowned biologist E.O. Wilson: Put aside half the surface of the Earth -- both land and oceans -- for the betterment of the nature and biodiversity. Maybe that sounds like a lot, but Wilson argues it's necessary if we want to avert crisis. Some 84% of species could be saved if we protected all that land. "That amount, as I and others have shown, can be put together from large and small fragments around the world to remain relatively natural, without removing people living there or changing property rights," Wilson wrote in an op-ed in The New York Times.

The trouble: We're not protecting nearly enough, according to experts. Currently, only 15% of land and 4% of the world's oceans are protected from encroachment by humans, mostly in the form of farms. Already, people have used up nearly 40% of the world's land for farms and raising livestock -- much of it to grow feed for cattle. Eating less meat -- or going vegetarian -- uses less land (and is far better for the climate; beef is an especially big polluter).

3. FIGHT ILLEGAL WILDLIFE TRAFFICKING

Some of the world's most iconic species -- particularly the elephant and rhino -- are threatened with extinction simply because people are slaughtering these majestic creatures to sell their body parts on the black market. Elephant ivory is carved into trinkets. And rhino horn is mistakenly sold as an aphrodisiac.

And there are other less-known markets, too, including those for pangolin meat (a delicacy), giraffe tails (bracelets) and tiger bone (medicine). Efforts to shut down these markets have been grossly inadequate, as the black market in environmental products is estimated to be worth $91 billion to $258 billion per year. Compare that to drug trafficking, the most lucrative black market, which is worth $344 billion per year, according to a United Nations and Interpol estimate.

Experts say better law enforcement is needed to stop poaching. And consumers -- especially those in Asia, where wildlife products tend to be popular -- need to stop buying these illegal and harmful goods. Groups like WildAid and Education for Nature Vietnam are using advertising campaigns to try to make these products seem uncool.

4. SLOW HUMAN POPULATION GROWTH

It sounds callous, but more people means more food, more land and more resources. Ehrlich, from Stanford, said population growth is one of the main drivers of the Earth's extinction crisis. The population was about 4 billion in 1980. It's now 7.4 billion and is rapidly heading for 9.7 billion by 2050, according to the United Nations.

There are ways for each person to conserve, of course. The World Bank says the average American, for example, produces about 10 times as much climate-change pollution per year as an average person from India. And we needlessly use resources we know are harmful. Plastics, for example, are clogging the world's oceans. We dump the equivalent of one garbage truck of plastic into the ocean each minute, according to the World Economic Forum. Some researchers expect there to be more plastic than fish in the ocean, by weight, by the year 2050. That's almost unthinkable.

5. RECONNECT WITH THE NATURAL WORLD, AND OPEN OUR EYES

If there's a fact that underlies all this, perhaps it's this: We're no longer connected to nature. We don't understand it and therefore, naively, dangerously, we figure it's doing just fine or will rebound. Barnosky, the extinction expert from Stanford, said we think of the natural world like a bottomless checking account when we need to see it as a savings account.

We humans also have ridiculously short attention spans. Issues like extinction and climate change play out over decades, centuries and millennia. Our actions now -- or inaction -- will matter for thousands of years. "You can have catastrophic events that are seen in slow motion, basically, and not register on people very well," said Ehrlich. We must find a way to reconnect with nature and to see this wave of extinction for the crisis that it is.

Have other ideas or questions? Please e-mail me: john.sutter@cnn.com.

Editor's Note: John D. Sutter is a columnist for CNN Opinion who focuses on climate change and social justice. Follow him on Snapchat, Facebook and email. This story is part of a CNN series called "Vanishing." Learn more about the sixth extinction and get involved.

Sunday, December 18, 2016

Half the world's species failing to cope with global warming as Earth races towards its sixth mass extinction

Professor John Wiens describes Donald Trump's election as a disaster for the planet
Ian Johnston Environment Correspondent
Thursday 8 December 2016
The Independent Online


The world has warmed by about 1C above pre-industrial levels Nasa


Nearly half the species on the planet are failing to cope with global warming the world has already experienced, according to an alarming new study that suggests the sixth mass extinction of animal life in the Earth’s history could take place in as little as 50 years.

A leading evolutionary biologist, Professor John Wiens, found that 47 per cent of nearly 1,000 species had suffered local extinctions linked to climate change with populations absent from areas where they had been found before.

Professor Wiens, who is editor of the Quarterly Review of Biology and a winner of the American Society of Naturalists’ Presidential Award, said the implications for the future were serious because his review showed plants and animals were struggling to deal with the relatively small amount of global warming experienced to date.

So far the world has warmed by about 1C above pre-industrial levels, but it is expected to hit between 2.6 and 4.8C by 2100 if nothing is done to reduce greenhouse gases.


Another problem facing life on Earth is the election of climate science denier Donald Trump as US president, which Professor Wiens, of Arizona University, described as a “global disaster”.

In his study, published in the journal PLOS Biology, the scientist examined academic papers about 976 different species from all over the world that had been studied at least twice, once about 50 years ago and again within the last 10 years.

“In almost half the species looked at, there have been local extinctions already,” he said.

“This is stuff that’s already happened with just a small change to the climate. We’re looking at a two to five-fold increase [in warming over the next century].

“What it shows is species cannot change fast enough to keep up with a small change in climate. That’s the big implication – even a small change in temperature and they cannot handle it.”

The study looked at 716 different kinds of animals and 260 plants from Asia, Europe, North and South America, and elsewhere.

Local extinctions were found to have occurred among 47.1 per cent of species at the “warm edge” of their traditional range, as it became too hot for them. There were few areas of the planet that were unaffected.

“Overall, the frequency of local extinctions was similar across most climatic zones, habitats, gradients and clade,” the PLOS Biology paper said.

However Professor Wiens found climate-related local extinctions were “substantially higher” among freshwater species at 74 per cent of the 31 studied.

The current rate of global extinction of animals and plants is believed to be faster than some of the five great extinction events in the Earth’s history, but so far the total number lost does not compare to the species lost when the dinosaurs were wiped out about 65 million years ago.

However one reason geologists are considering declaring a new epoch in the planet’s history is the rapid loss of flora and fauna that will have a noticeable effect on the fossil record.

Professor Wiens said: “It’s true that in terms of global extinction of entire species that have already happened, I think we’re not there [at the sixth mass extinction] yet.

“But I think unfortunately we are on track for that to happen. 

“That’s sort of the good news – it hasn’t happened yet. But if we don’t do anything it seems like that’s going to happen in the next 50 to 100 years.”

There were already “two bad signs” that Mr Trump’s election would make things worse, Professor Wiens said.

“One would be this person he’s assigned to head the EPA [renowned climate science denier Scott Pruitt] and the other thing is pulling out of the Paris accord [on climate change],” he said.

“The EPA in this country, they are the ones supposed to be protecting the environment.”Climate change: It's "game over" for planet earth


In what was perhaps a sign of the desperation felt by environmental scientists in the US and elsewhere, he jokingly suggested the UK should invade the US or the US and Canada should swap leaders with Justin Trudeau taking over in the White House.

Asked what he would really say to Mr Trump if they met, Professor Wiens said: “I guess I would tell him ‘what would you think if there was a country on the other side of the world that was releasing gas that was going to cause extinctions in our country, to hurt our crops and make people starve’.

“He would say, ‘tell me where it is and we’ll bomb them tomorrow’. Then I’d say, ‘this is what we’re doing to other countries because we are the big polluters.’

“People are already having serious problems with food security. People are going to die and it’s going to be the fault of our country and other big polluters.

“There is no question he would militarily intervene against a country that was doing to us what we are doing to other countries.”

This article has been altered to remove a joking remark made by Professor Wiens about Donald Trump. Several websites have misrepresented the comment as a serious suggestion, omitting the key context that it was meant as a joke, and Professor Wiens has received a number of threatening emails and phonecalls.

Thursday, December 15, 2016

The Meeting That Gave Birth to the Idea of Global Tectonics

Fifty years ago, scientists began to connect details of an idea with profound implications: Earth's ocean crust recycles itself on a global scale, and continents move across the face of the planet.
By  
This week, scientists from across the world are gathered at the American Geophysical Union’s (AGU) Fall Meeting in San Francisco. They attend to be a part of history—at such meetings, those who convene present new results, build collaborations, refine ideas, and engage in discussions that could change the very course of our science.
Iceland’s Thingvellir rift, a site of spreading phenomena first discussed at the History of the Earth's Crust Symposium.
Thingvellir, a deep fissure in Iceland where the central rift of the Reykjanes Ridge passes across Iceland. At this rift, scientists can see the seafloor spreading phenomena first discussed 50 years ago at the History of the Earth’s Crust Symposium. Credit: Chris FordCC BY-NC 2.0
For those involved with seismology, paleomagnetism, and global tectonics, this year’s event marks an important anniversary of another meeting 50 years ago. On 11–12 November 1966, a crucial meeting took place in New York City at NASA’s Goddard Institute for Space Studies. Called the History of the Earth’s Crust Symposium, the gathering brought together geologists and geophysicists interested in the evolution of continents and oceans, especially in new ideas pertaining to continental drift and the origins and history of the ocean floors.
At the time of the meeting, most geologists believed that the continents and ocean basins were fixed features on Earth’s surface. But at the meeting, separate streams of ongoing research became united, and what emerged was profound and revolutionary in its implications: Earth’s ocean crust recycles itself on a global scale, and continents move across the face the planet.

An Auspicious Time

The History of the Earth’s Crust Symposium occurred at an auspicious time in the geological sciences. New evidence bearing on the evolution of Earth’s crust was just coming to light, from magnetic analysis of surface rocks, sediment cores, and shipboard magnetics data and from seismic data from the world’s oceans. Much of this new information was still unpublished at the time of the meeting.
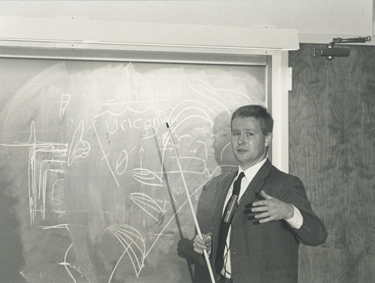
John Dewey of Cambridge discusses the Appalachian-Caledonian mountains at the History of the Earth’s Crust Symposium.
John Dewey of Cambridge discusses the origins of the Appalachian-Caledonian mountain range at the History of the Earth’s Crust Symposium. Credit: Barrett Gallagher
The meeting was organized by geochemist Paul Gast of the Department of Geology at Columbia University and astronomer Robert Jastrow, director of the Goddard Institute. These organizers realized that new research on geomagnetic reversals, earthquake activity, the nature of the oceanic crust, and the causes of tectonic episodes was coming together in ways that presaged a revolution in the study of Earth’s evolution.
The guest list was impressive and included Harry Hess and Fred Vine of Princeton; Maurice Ewing, Lynn Sykes, James Heirtzler, Xavier Le Pichon, Neil Opdyke, and Walter Pitman from the nearby Lamont Geological Observatory; Henry Menard of the University of California, San Diego; Edward Bullard, John Dewey, and Dan McKenzie from Cambridge; Patrick Hurley of the Massachusetts Institute of Technology; Marshall Kay of Columbia; and other geological luminaries. It marked the first time that geologists and geophysicists came together to focus on what became the new global tectonics [Phinney, 1968].

A Focus on Geomagnetic Reversals

The attendees were particularly interested in new results related to Earth’s magnetism and the subject of geomagnetic reversals. Meeting attendees knew that Earth experienced episodes when the geomagnetic poles flipped, when geomagnetic north became south and south became north.
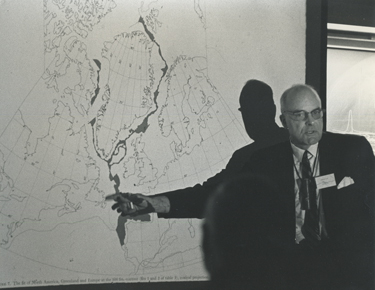
Marshall Kay of Columbia discusses the Appalachian-Caledonian orogeny at the History of the Earth’s Crust Symposium.
Marshall Kay of Columbia University points out the positions of the continents during the Appalachian-Caledonian orogeny, an event that occurred prior to the opening of the present Atlantic Ocean. Kay’s talk was one of several at the History of the Earth’s Crust Symposium. Credit: Barrett Gallagher
Prior to the meeting, Allan Cox of Stanford and Richard Doell and Brent Dalrymple of the U.S. Geological Survey in Menlo Park, Calif., had established the timescale of reversals of Earth’s magnetic field for the past few million years [Cox et al., 1964]. They had accomplished this by measuring the magnetic polarities and ages of volcanic rocks from many different oceanic islands and some continental areas.
Their methods will be familiar to anyone who’s worked on paleomagnetism since: They carefully drilled oriented samples from volcanic lava flows and measured their direction of magnetization in the lab. At the same time, they performed radiometric dating of their samples to provide a time history for the magnetic flips they detected. They found that during specific time intervals, paleomagnetic signatures followed the same pattern worldwide.
The internal consistency of the worldwide paleomagnetic and radiometric results established that the polarity events were the result of a rapid switching of the geomagnetic poles and could be correlated from one place to another. Cox, Doell, and Dalrymple brought this new insight to the History of the Earth’s Crust Symposium.

Signatures in Ocean Sediment

At the same time, Neil Opdyke and his students at the Lamont Geological Observatory were studying sediment cores from the ocean floor. These sediments, the researchers found, contain grains of magnetite that align themselves in the direction of the magnetic field at the time they were deposited. In this way, the scientists were able to determine the direction of the Earth’s magnetic field as a function of time downward through the cores [Opdyke et al., 1966].
Opdyke’s team presented these new results at the symposium. Together, the researchers verified a remarkable result: Ocean sediment cores vertically showed in detail the same sequence of reversals found in the volcanic rocks dated by Cox, Doell, and Dalrymple. The field of magnetostratigraphy was born.

Seafloor Stripes

Also remarkable was the prediction by Fred Vine and Drummond Matthews of Cambridge that because of ongoing seafloor spreading and the reversals of Earth’s magnetic field, the magnetism of the ocean floor rocks should be arranged as a series of stripes of normally and reversely magnetized crust. They proposed that these stripes run parallel to and symmetrical with the mid-ocean ridges [Vine and Matthews, 1963].
Studies of the magnetic pattern on the Reykjanes Ridge south of Iceland reported at the meeting showed exactly this configuration of reversed and normally magnetized crust. By towing a magnetometer (an instrument that records the strength of Earth’s magnetic field) behind a ship, researchers discovered that when a magnetometer passes over normally magnetized ocean floor, Earth’s magnetic field is enhanced, whereas over reversely magnetized ocean crust the magnetic field is weakened.
The pattern of normal and reversed stripes of ocean floor matched the pattern of geomagnetic reversals found by dating the rocks from continents and oceanic islands and also matched that discovered by Opdyke in his deep-sea cores.

Magic Magnetic Profiles

(top) Magnetic anomalies, imaged by while traveling across a mid-ocean ridge near Antarctica. (middle) A mirror image of the top profile, reflected across the ridge axis. Note the symmetry in the two profiles. (bottom) A model generated by assuming normal and reversed ocean crust as shown as black and white banded chrons. Credit: Pitman and Heirtzler, [1966]/AAAS
(top) Magnetic anomalies, imaged while traveling across a mid-ocean ridge near Antarctica. (middle) A mirror image of the top profile, reflected across the ridge axis. Note the symmetry in the two profiles. (bottom) A model generated by assuming normal and reversed ocean crust as shown as black and white banded chrons. Credit: Pitman and Heirtzler [1966]/AAAS
Probably the most astounding discovery was the first report of the R/V Eltanin 19 “magic” magnetic profile, taken as the ship traveled across the Pacific Antarctic sector of the mid-ocean ridge. The discovery, presented by Walter Pitman and Jim Heirtzler from Lamont, showed the same symmetrical magnetic anomalies occurring in the ocean basins far from the axes of the ocean ridges, going back more than 10 million years in geologic time [Pitman and Heirtzler, 1966].
What’s more, Pitman and Heirtzler demonstrated that the patterns of magnetic anomalies could be reproduced by models in which the seafloor was spreading at rates from 1 to a few centimeters per year. They shared their findings at the symposium, and within a few years, scientists were able to use the same techniques to extend the magnetic timescale back more than 70 million years.

Confirmation from Around the World

The confluence of those three lines of research—tracing the Earth’s magnetic reversals in volcanic rocks, in cores of sediment, and on the oceanic crust—transformed geology and geophysics from a collection of unrelated data to a new and dynamic subject. These discoveries represented a paradigm shift in the geosciences.
Edward Bullard of Cambridge University discusses heat flow at the History of the Earth’s Crust Symposium.
Edward Bullard of Cambridge University discusses the distribution of heat flow from the oceanic crust at the History of the Earth’s Crust Symposium. Credit: Barrett Gallagher
Independent evidence of seafloor spreading came from measurements of oceanic heat flow by Xavier Le Pichon, who showed excess heating over the ocean ridges, with the crust cooling and subsiding as one moved farther from the ridge crest [Langseth et al., 1966]. Seismological evidence developed by Lynn Sykes at Lamont showed that earthquakes were occurring along the axis of the mid-ocean ridge and on sectors of transverse offsetting faults between the ridge segments [Sykes, 1967]. Using first-motion studies of the earthquakes, Sykes showed that the movement along the faults was not in the direction of the offsets, as might be expected, but the reverse. They were not transcurrent faults but “transform faults” as hypothesized by Wilson[1965] just a year earlier.
Independent geologic evidence of continental drift was also presented at the symposium in the form of Edward Bullard’s computer fit of the continents around the Atlantic Ocean [Bullard et al.,1965], Pat Hurley’s compilation of ancient radiometric age data of the continents from West Africa and South America showing that the patterns matched [Hurley et al., 1967], John Dewey and Marshall Kay’s reconstruction of the Appalachians and Caledonides prior to the origin of the present Atlantic Ocean [Dewey and Kay, 1968], and the presentation of polar wander (now seen as mostly the result of continental drift) by Ted Irving of the University of Leeds and others [Irving, 1964].

A Field Is Born

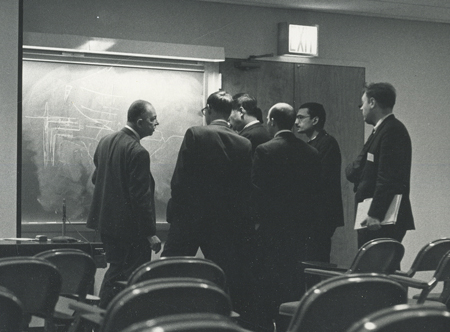
Scientists discuss seafloor spreading at the History of the Earth’s Crust Symposium.
Harry Hess of Princeton University (on the left) discusses seafloor spreading with attendees at the History of the Earth’s Crust Symposium. Paul Gast of Columbia University is on the right. Credit: Barrett Gallagher
It is not too rash to say that all of the major players at the conference left the meeting and returned to their respective institutions convinced by the overwhelming evidence that continental drift and seafloor spreading were real. The 2-day meeting in New York City 50 years ago can be pinpointed as the moment when the idea of new global tectonics became a reality.
Now, as we give our talks and present our posters at the Fall Meeting, we can find inspiration in this gathering of scientists half a century ago. We are still feeling the repercussions of that meeting today.
What new fields of research might be born through presentations and scientific discussions this week in San Francisco? We’ll have to wait and see.

References

Bullard, E. C., J. E. Everett, and A. G. Smith (1965), Fit of continents around the Atlantic, Philos. Trans. R. Soc. London, Ser. A258, 41–75.
Cox, A., R. R. Doell, and G. B. Dalrymple (1964), Reversals of the Earth’s magnetic field, Science144, 1537–1543.
Dewey, J., and M. Kay (1968), Appalachian and Caledonian evidence for drift in the North Atlantic, in The History of the Earth’s Crust: A Symposium, edited by R. A. Phinney, pp. 161–167, Princeton Univ. Press, Princeton, N.J.
Hurley, P. M., et al. (1967), Test of continental drift by comparison of radiometric ages, Science157, 495–500.
Irving, E. (1964), Paleomagnetism and Its Application to Geological and Geophysical Problems, John Wiley, New York.
Langseth, M. G., Jr., X. Le Pichon, and M. Ewing (1966), Crustal structure of the mid-ocean ridges: 5. Heat flow through the Atlantic Ocean floor and convection currents, J. Geophys. Res.71(22), 5321–5355, doi:10.1029/JZ071i022p05321.
Opdyke, N. D., et al. (1966), Paleomagnetic study of Antarctic deep-sea cores, Science154, 349–357.
Phinney, R. A. (Ed.) (1968), The History of the Earth’s Crust: A Symposium, 244 pp., Princeton Univ. Press, Princeton, N.J.
Pitman, W. C., and J. P. Heirtzler (1966), Magnetic anomalies over the Pacific-Antarctic ridge, Science154, 1164–1171.
Sykes, L. R. (1967), Mechanisms of earthquakes and nature of faulting on the mid-ocean ridges, J. Geophys. Res., 72, 2131–2153.
Vine, F. J., and D. H. Matthews (1963), Magnetic anomalies over oceanic ridges, Nature199, 947–949.
Wilson, J. T. (1965), A new class of faults and their bearing on continental drift, Nature207, 343–347.

Author Information

Michael R. Rampino (email: mrr1@nyu.edu), Department of Biology and Department of Environmental Studies, New York University, New York
Citation: Rampino, M. R. (2016), The meeting that gave birth to the idea of global tectonics, Eos, 97, doi:10.1029/2016EO063933. Published on 12 December 2016.