
CityLab
LAURA BLISS
@mslaurabliss
Jun 9, 2016
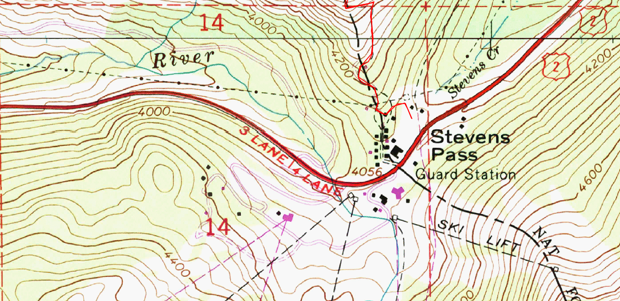 An example of a modern-day relief map using contour lines. (Flickr/Bravenboer)
You’ve seen them on trail maps, road maps, and engineering plans. For centuries, contour lines have been a standard cartographic convention. Used to represent the elevation of land and mountains, to modern map-readers the curving marks are implicit representations of reality, as true as the blue of an oceanic map.
But as with most things in this human-built world, contour lines had to be invented. Their origins lie with Charles Hutton, a British mathematician whose ambitious 1774 survey of a Scottish peak called Schiehallion marked their first known use. That map was lost to history, but his original charts and tables of survey points were not.
Now, a British visual artist has painstakingly recreated Hutton’s map as part of her intensive online investigation of the history of the contour line. Karen Rannused Hutton’s centuries-old data to create a four-foot-square map of Schiehallion, mimicking Hutton’s draftsmanship and handwriting. She also turned those data points into an elegant 3-D model. Alongside artifacts from Hutton’s research, both of these cartographic works of art are on view at the Literary and Philosophical Society in Newcastle, where Rann currently lives and where Hutton once called home.
It’s an effort to resuscitate the importance of Hutton and his contribution to mathematics and cartography, says Rann, who learned about Hutton’s story from a short television program.
“I thought there would be a book about the invention of contour lines, but no one has written it,” she tells CityLab. “And the map that Charles Hutton had drawn is missing. There was this whole detective story and nobody was bothering with it.”
@mslaurabliss
Jun 9, 2016
An example of a modern-day relief map using contour lines. (Flickr/Bravenboer)You’ve seen them on trail maps, road maps, and engineering plans. For centuries, contour lines have been a standard cartographic convention. Used to represent the elevation of land and mountains, to modern map-readers the curving marks are implicit representations of reality, as true as the blue of an oceanic map.
But as with most things in this human-built world, contour lines had to be invented. Their origins lie with Charles Hutton, a British mathematician whose ambitious 1774 survey of a Scottish peak called Schiehallion marked their first known use. That map was lost to history, but his original charts and tables of survey points were not.
Now, a British visual artist has painstakingly recreated Hutton’s map as part of her intensive online investigation of the history of the contour line. Karen Rannused Hutton’s centuries-old data to create a four-foot-square map of Schiehallion, mimicking Hutton’s draftsmanship and handwriting. She also turned those data points into an elegant 3-D model. Alongside artifacts from Hutton’s research, both of these cartographic works of art are on view at the Literary and Philosophical Society in Newcastle, where Rann currently lives and where Hutton once called home.
It’s an effort to resuscitate the importance of Hutton and his contribution to mathematics and cartography, says Rann, who learned about Hutton’s story from a short television program.
“I thought there would be a book about the invention of contour lines, but no one has written it,” she tells CityLab. “And the map that Charles Hutton had drawn is missing. There was this whole detective story and nobody was bothering with it.”
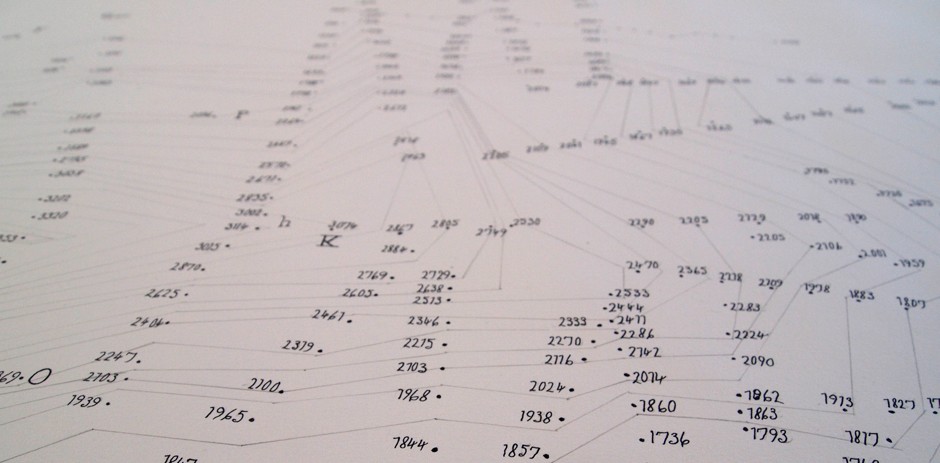 A detail from Rann’s re-created map. (Courtesy of Karen Rann)
It’s an enchanting story of the Enlightenment era. Hutton didn’t invent contour lines in order to represent Schiehallion’s 3,500-foot height. Rather, he created them to solve a problem with which he’d been tasked: weighing the mountain.
This project was all part of a grant from the Royal Society to calculate the weight of the Earth using Newton’s theory of gravitation, led by the astronomer Nevil Maskelyne. This required several challenging steps. The first involved dangling perfectly vertical pendulums from the mountain’s peak to measure the gravitational pull of the mountain, and determining from that, following Newton, its weight. The second was to calculate the volume and density of the mountain, which the scientists would then scale up to weigh the entire planet.
How would you set about weighing a mountain? Perhaps inspired by isobath lines—which had been already been used to show water depth—Hutton broke his task down into parts. The Institute of Mathematics and its Applications, a U.K. professional society, explains:
[Hutton] divided the mountain up into horizontal slices at regular intervals and worked out the volume of each slice. This was relatively straight forward as the mountain was chosen for its symmetrical nature. He then simply added the volume of each slice together to give the volume of the whole mountain. In [mapping this out], he had invented the idea of contour lines still used to this day.
Impressively, Maskelyne and Hutton did manage to estimate the weight of the planet within a 20 percent margin of error, and the Schiehallion experiment has gone down as one of the most influential in history. By the 19th century, Hutton’s contour lines would be adapted by European mapmakers to depict elevation—an essential referent for the industrial era’s new focus on mining and building railways and roads.
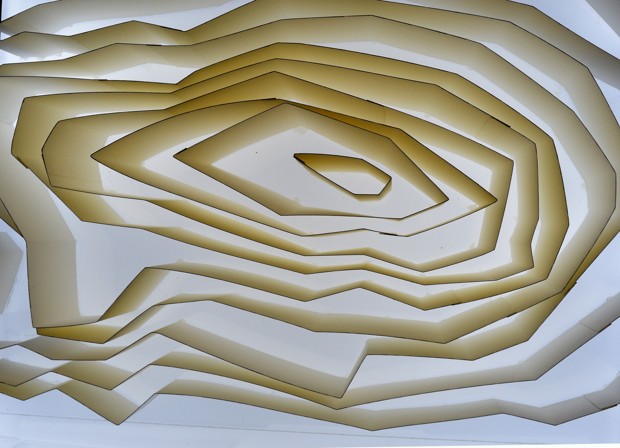 Rann’s 3D model of Schiehallion, according to Hutton’s contour lines. (Courtesy of Karen Rann)
But Hutton’s contributions have flown under the radar of history, says Rann, who can’t completely explain why she felt such a kinship to him. It’s partly their shared homeland, partly the fact that she just loves maps. “It’s hit a chord with a lot of people here, as well,” she says.
But on her blog, Rann waxes a little more poetic about what might make contour lines so enchanting:
Maps are usually drawn to define boundaries, often for defence or attack; or they are drawn for travellers, or landowners wanting to quantify what they possess. These maps are filled with symbols that represent things visible in that landscape: woods and windmills, roads, rivers, bridges and mountain ranges.
The maps explored here were the first to include those tentative lines that expose a quality of our world needing to be understood, to be calculated or defined, through the use of a line or lines which are not visible within the landscape because they are not there.
Hutton may not have intended to invent the contour line, but somewhat like Newton, he showed the world an invisible quality that was indispensable for understanding the world. Map-readers are forever grateful.
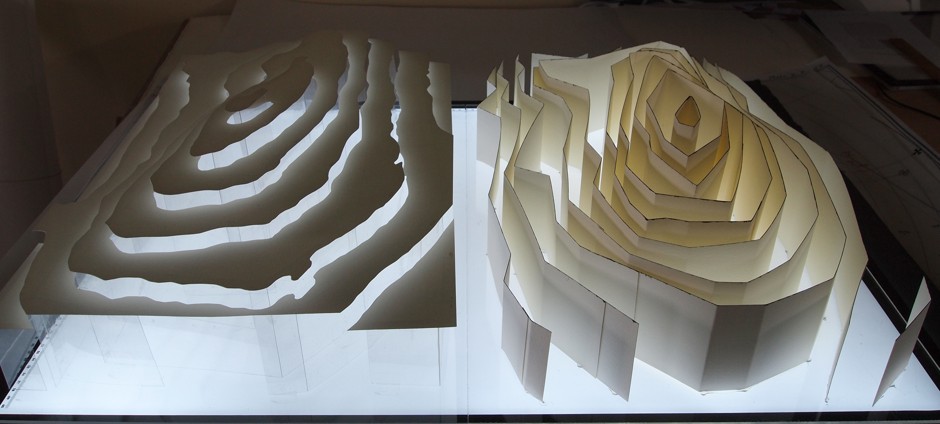 Rann’s 3D model of Schiehallion, according to modern Ordnance Survey contour lines (left), compared to Rann’s 3D model of Schiehallion following Hutton’s contour lines. (Courtesy of Karen Rann)
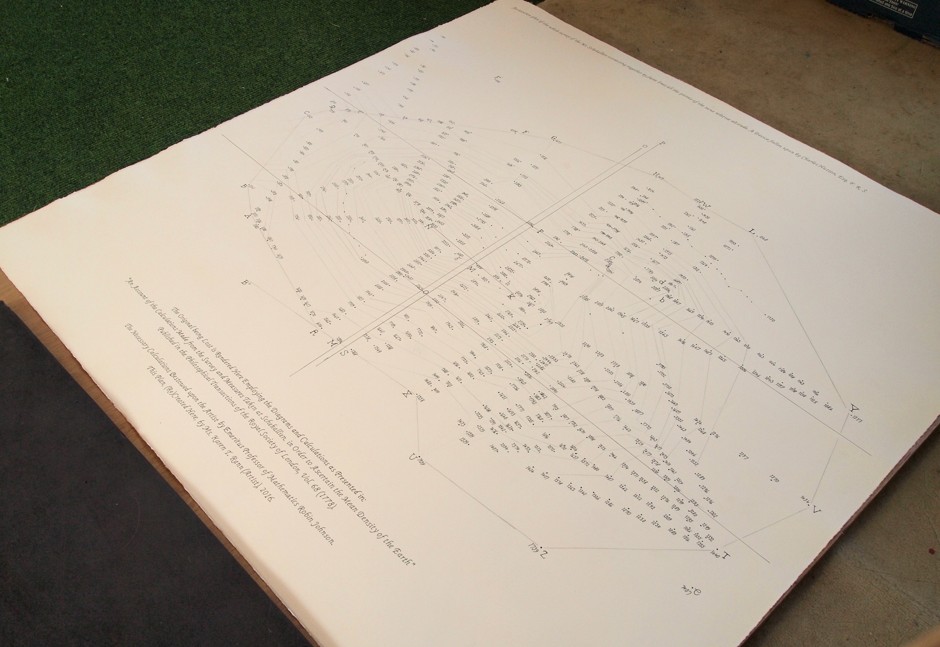 Karen Rann’s re-creation of the original Hutton survey map. (Courtesy of Karen Rann)
No comments:
Post a Comment