vangeog - The Art of Geography

Visitors

Wednesday, November 30, 2016

The Journey That Reveals the Scope of Earth's History

  • Vivien Cumming

BBC - Earth26 November 2016
Scotland is known for its rugged and mountainous landscape, but most of us do not realise that its rocks are some of the oldest in the world. They tell the story of some of the biggest changes in Earth's history.


Scotland's landscape holds many of Earth's secrets (Credit: Vivien Cumming)


Scotland's rocks were among the first to be studied by 19th-Century geologists. Those studies formed the grounding for our modern understanding of earth processes like plate tectonics and climate change.

The region known as Assynt is arguably one of the most stunning areas of Scotland. It is here that Earth's history is recorded for all to see.


Looking over Assynt's landscape from the top of Suilven (Credit: Vivien Cumming)


If you drive along the A837, along the shores of Loch Assynt, you are actually driving through Earth's history. You might not notice this at first, because on one side you have "boring" rocks and on the other the stunning Loch Assynt. But in fact it is those seemingly mundane rocks that hold some of Earth's biggest secrets.

By the way, we hope this goes without saying, but if you want to experience this for yourself, for safety's sake let someone else do the driving.


The shore of Loch Assynt (Credit: Vivien Cumming)


The rocks exposed beside the road in the west, at the Lochinver end of the Loch, are extremely ancient. They are a kind of rock called "Lewisian gneiss" and are over 3 billion years old. When they formed, the only life on Earth was single-celled microbes.

These rocks make up much of the low-lying, heather-covered craggy land in the area, running along the north-west coast of Scotland and into the Outer Hebrides. Nowadays they do not look anything like they would have when they were deposited. Earth's long history has heated, melted and wrenched them around, giving them a black-and-white stripy look.


The oldest rocks make up the low-lying land (Credit: Vivien Cumming)


Near Loch Assynt, on a beautiful beach at Achmelvich, you can see further evidence of how our world has changed. The rocks along the coast are twisted and contorted. They have been buried and crushed, heated and moved.


The beach at Achmelvich (Credit: Vivien Cumming)


For billions of years these old rocks were uplifted and eroded, until about 1 billion years ago when sandstone was deposited on top. This "Torridonian sandstone" now makes up some of the most spectacular peaks in the region, such as Suliven and Quinag. By the time this sandstone had been deposited, the level of oxygen in the atmosphere had risen and multicellular life was beginning to take hold.


Suilven's peak juts out over the landscape (Credit: Vivien Cumming)


As you cross the boundary between the ancient Lewisian gneiss and the newer Torridonian sandstone, you are making a 2-billion-year leap in Earth's history. No rocks were laid down in the intervening eons, so you instantly travel from a time when there was almost no oxygen in the air to a time when complex life was starting to proliferate.


Torridonian sandstone atop Suilven, looking out over older rocks (Credit: Vivien Cumming)


As you continue east along the loch towards Ardvreck Castle, you approach the junction with the A894. There, pink-and-white quartzite rocks make up the cliffs beside the road.

Towards the top of these rocks, you may be able to see odd pipe-like structures. This "pipe rock" is thought to be fossilised burrows, maybe formed by worm-like creatures.


Looking towards Loch Assynt and the A894. The pink-white rocks of the mountains are Cambrian quartzite (Credit: Vivien Cumming)


The pipe rock is part of a sequence of sedimentary rocks deposited during the Cambrian Period, which began 540 million years ago. This is one of the most important times in Earth's history as many new kinds of complex, multicellular life made their first appearance in the fossil record. Among many others, it was the origin of the famous trilobites.

These rocks were first deposited in the ocean. They are very similar to rocks on the east coast of North America, and form many of the mountains to the north and east of Ardvreck Castle.


Ardvreck castle in Loch Assynt, near mountains of Cambrian rock (Credit: Vivien Cumming)


After the Cambrian sedimentary rocks were deposited, the region underwent the "Caledonian Orogeny": a period when the rocks were squeezed from the sides, pushing them up to form mountains. This happened between 470 and 430 million years ago. Much of our understanding of the process of mountain-building comes from the early studies of these famous Scottish mountains.


View towards the Moine Thrust near Inchnadamph (Credit: Vivien Cumming)


But the geology does not stop with the dawn of complex life. Another famous geological hotspot in the region is known as the Moine Thrust, a place where the older Lewisian gneiss sits on top of the younger Cambrian quartzite.

This confused the 19th-Century geologists Benjamin Peach and John Horne, as rocks should lie from old to young going upwards as they were deposited. These two geologists made a discovery that still underpins our geological knowledge today. They realised that rocks could be twisted and even turned upside-down, just like in modern mountain ranges and active fault zones today.


Looking over the Assynt region (Credit: Vivien Cumming)


So if you ever visit Scotland, maybe take a drive along the A837. Remember the age of the Earth, and remember that the beautiful scenery was ultimately created by these slow geological processes.

This story is a part of BBC Britain – a series focused on exploring this extraordinary island, one story at a time. Readers outside of the UK can see every BBC Britain story by heading to the Britain homepage; you also can see our latest stories by following us on Facebook and Twitter.
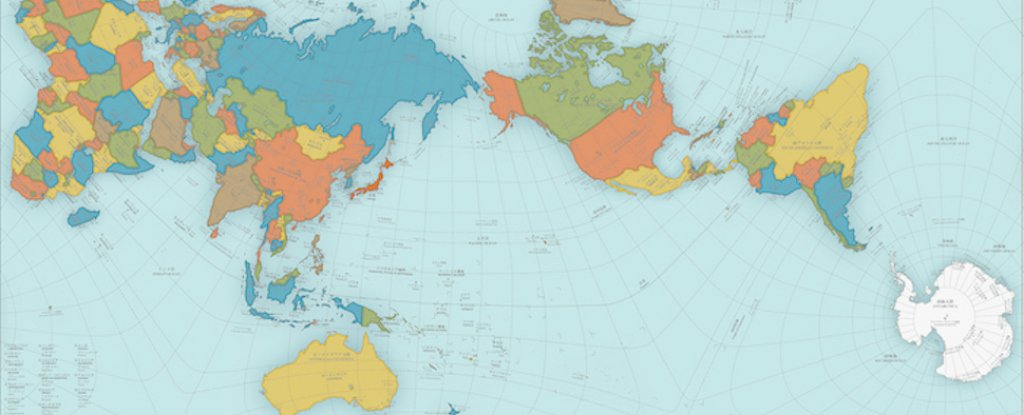
Posted by Paul VanZant at 4:57 AM No comments:
Email ThisBlogThis!Share to XShare to FacebookShare to Pinterest

Tuesday, November 29, 2016

This bizarre world map is actually crazily accurate


AuthaGraph

Nothing's as you think it is.

FIONA MACDONALD
Science Alert
2 Nov 2016


We all know most maps of the world aren't entirely accurate. For starters, Africa is way bigger than it looks, and Greenland isn't nearly so vast.

But now a designer in Japan has created a map that's so accurate it's almost as good as a globe, and it's probably one of the best estimations you'll see of the real size of countries.

The design, called AuthaGraph, is so good, it's just taken out Japan's biggest design accolade, the Good Design Award.

Created by artist and architect Hajime Narukawa, the map looks pretty weird at first glance, with an orientation shift between Asia and North America, but it's actually one of the most proportional maps we've got.

That's because creating a precise a flat map of our spherical planet is incredibly hard.

The map you're used to seeing pinned on classroom walls and in Atlases is known as a Mercator projection, and was first presented by the Flemish geographer Gerardus Mercator back in 1569.

This technique works to more or less fit the countries of the globe on a two-dimensional piece of paper, and is great for ocean navigation. But it comes at the expense of accuracy - the Mercator projection makes countries close to the pole look much bigger than they really are.

For example, Greenland looks roughly the same size as Africa on most maps, even though the African continent has 14 times more land mass.


But the new AuthaGraph design aimed to fix that, by dividing the globe up into 96 equal regions, and then transferring those dimensions from a sphere to a tetrahedron, before generating the final map.

By taking a few steps to get from a rounded sphere to a flat map, Narukawa managed to maintain the correct area ratios of land and water.

AuthaGraph

"This original mapping method can transfer a spherical surface to a rectangular surface such as a map of the world while maintaining correctly proportions in areas," says the Good Design Award description.

"AuthaGraph faithfully represents all oceans, continents including the neglected Antarctica. These fit within a rectangular frame with no interruptions. The map can be tessellated without visible seams. Thus the AuthaGraphic world map provides an advanced precise perspective of our planet."

AuthaGraph

This new map isn't perfect - and seeing as north isn't necessarily at the top, it might not be the best for navigation. But it's pretty close.

"The map [needs] a further step to increase a number of subdivision for improving its accuracy to be officially called an area-equal map," the Good Design Award description reads.

You can find out more and get your own copy of the map here.
Posted by Paul VanZant at 4:53 AM No comments:
Email ThisBlogThis!Share to XShare to FacebookShare to Pinterest

Saturday, November 26, 2016

These Beautiful Maps Reveal the Secret Lives of Animals

National Geographic
Greg Miller
Nov 16, 2016


New technology lets mapmakers follow baboons, vultures, and everything in between.


Tracking data from grey-headed albatrosses reveals how some birds stay home while others follow the winds to make a 25,000-kilometer migration around Antarctica.


It wasn’t so long ago that tracking wild animals meant slogging through the forest with a clipboard and binoculars, hoping for a glimpse of an animal—or at least a pile of poo. But in recent years, technology has made it possible to track animal movements from afar in more and more detail, whether it’s albatrosses circling Antarctica, loggerhead turtles migrating across the Atlantic, or African elephants trying to navigate a landscape increasingly interrupted by human settlements.

Geographer James Cheshire and designer Oliver Uberti (formerly of National Geographic) have dipped into this deluge of data to create 50 beautiful and engaging maps that reveal the wanderings of animals captured by satellites, camera traps, drones, and other tools. The result is their latest book, Where the Animals Go.

The authors spoke to scores of scientists. Although a few researchers weren’t willing to share data they’d spent years or even decades collecting, many more were happy to help. Some of them are already posting their findings publicly on sites like Movebankand zoaTrack.


“They have more data than they could possibly process in a single career,” Cheshire says.


Sensors attached to griffon vultures show how the birds ride updrafts to higher altitudes in their search for food. Excerpted from Where the Animals Go by James Cheshire and Oliver Uberti (Particular Books, November 2016)


The book is filled with amazing journeys, like that of the record-setting Dutch terns who flew 90,000 kilometers from the Netherlands, down the west coast of Africa, over to Tasmania, and back home after a stay in Antarctica. It also contains the less familiar, but no less fascinating, movements of backyard bees in Germany, the vertical spiral of vultures catching rides on updrafts of warm air over France, and crocodiles defying the attempts of humans to relocate them in Australia.

As tracking devices have gotten smaller, faster, more packed with sensors, and able to store more data before running out of juice, scientists have been getting a finer-grained picture of how animals behave in the wild. “Not that long ago, scientists were getting one or two fixes a day” on the location of an animal they were tracking, Cheshire says. “Now they can get multiple fixes per second.”


Researchers are tracking a troop of baboons living along the Ewaso Ng’iro River in Kenya to study how groups of the animals decide when it’s time to move.


At Mplala Research Centre in Kenya, anthropologist Margaret Crofoot has been taking advantage of higher sampling rates to study decision-making behavior in baboons fitted with GPS collars. When one baboon wanders off from the group, do others follow? Does it depend on the status of the individual? These are the kinds of questions Crofoot is investigating.

One series of maps in the book shows what happened one day as two low-ranking baboons wandered off from the troop. To the researchers’ surprise, a few other individuals followed them within a few minutes, and soon the whole troop of 46 animals was on the move.

If social behavior is one frontier in animal tracking research, feeding behavior is another. “When we asked researchers the question of what’s next, they all say what they really want to know is how much animals are eating, because that’s the greatest indicator of how successful they are,” Cheshire says.

Rory Wilson at the University of Swansea has pioneered several methods for tracking food consumption in penguins, for example. One is a temperature gauge that registers when a penguin’s belly fills with cold fish from the icy waters; another is a “beakometer” that gives a measure of how much a bird eats by recording how often and how wide it opens its mouth.

If there’s a single lesson that emerges from all these animal tracking studies, Uberti says, it’s that animals behave as individuals. “They don’t move around en masse like furry robots,” he says. Just like humans, other animals have individual preferences in the routes they take, what they eat, and whose company they keep. Throughout the book, Uberti and Cheshire highlight the tracks of individual animals as well as those of their troops, flocks, and pods.

Indeed, Uberti says, the impetus for Where the Animals Go was a map he made to accompany a 2007 National Geographic article on elephant poaching. The map illustrated the path of an African elephant killed by poachers. “Working on that story was the first time a map had ever engaged me in the life of an individual animal, and the shift in consciousness it provoked was irreversible,” Uberti says in an interview posted on the book publisher’s website.


This map shows how Australian crocodiles, relocated because people thought they posed a threat, soon found their way back home.


Tracking technology is increasingly being used to protect animals as well as study them. In Tsavo National Park in Kenya, for example, the conservation group Save the Elephants has been using GPS collars to investigate whether elephants are using underpasses built for them when a railway was built across the park (early signs are encouraging).

Save the Elephants has also teamed up with technology companies to track elephants in real time and use data from the accelerometer in an animal’s collar (similar to the device in your smartphone that counts your steps) to send text message alerts if it slows down or stops moving—a possible indication that it’s been shot by poachers.

“If it drops below a certain threshold, they can notify law enforcement and send someone out to check on the animal,” Uberti says.


In Peru, researchers are using GPS trackers and camera traps to study the range of jaguars and how they share the forest with other animals.
Posted by Paul VanZant at 8:44 PM No comments:
Email ThisBlogThis!Share to XShare to FacebookShare to Pinterest

Friday, November 25, 2016

Watch Artisans Craft Old-Fashioned Globes By Hand


Kirstin Fawcett
mental_floss

Long before Google maps existed, we used globes to get a sense of the world’s scale. In the footage above—filmed in 1955 and archived by British Pathé, the UK newsreel archive company—you can watch artisans in a North London workshop assemble the tiny Earth replicas by hand. Layer by layer, they methodically cover a solid ball of wood in paper and plastic. Then, they paste a map across its outer surface and coat it in layers of varnish. The process is painstaking, which makes it all the more incredible that the workshop once produced more than 60,000 globes each year.
Posted by Paul VanZant at 9:51 AM No comments:
Email ThisBlogThis!Share to XShare to FacebookShare to Pinterest

Wednesday, November 23, 2016

The Deadliest Volcano in the United States Just Got Really Weird


Maddie Stone
11/01/16
Gizmodo


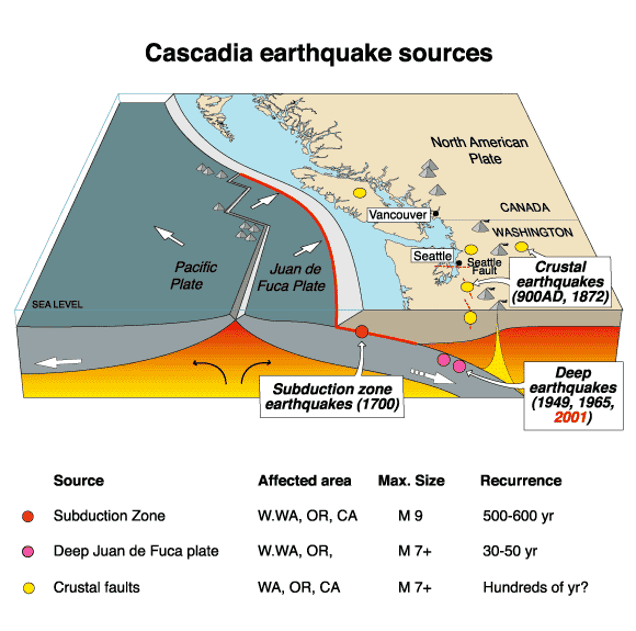
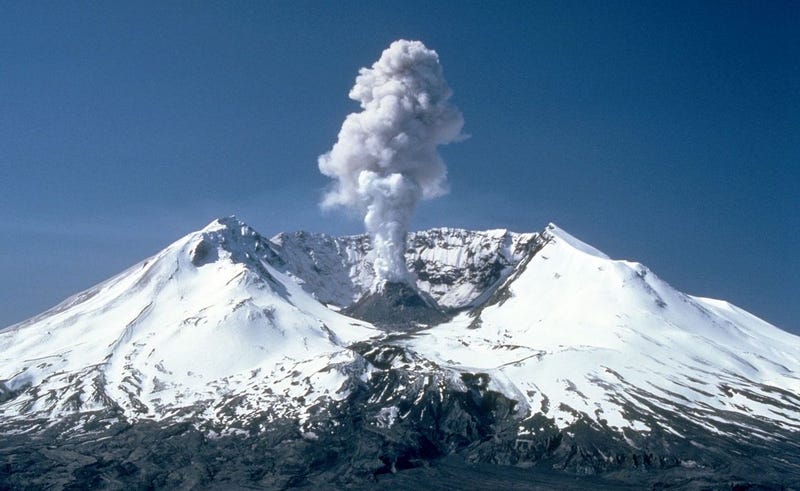
A A plume of steam and ash billowing out of Mt. Saint Helens in 1982, two years after the most destructive eruption in US history. Image: Wikimedia

Picture a volcanic eruption: fiery lava and smoke billowing skyward as a towering mountain empties its over-pressurized belly of a hot meal. At least, that’s how most of us think it works. So you can imagine volcanologists’ surprise when they discovered that Mount St. Helens, which was responsible for the deadliest eruption in US history, is actually cold inside.

Apparently, it’s stealing its fire from somewhere else.

Mount St. Helens is one of the most active volcanoes of the Cascade Arc, a string of eruptive mountains that runs parallel to the Cascadia subduction zonefrom northern California to British Columbia. It’s also one of the strangest. Most major volcanoes of the Cascade Arc sit neatly along a north-south line, where the wedging of the Juan de Fuca tectonic plate beneath the North American plate forces hot mantle material to rise. Mount St. Helens, however, lies to the west, in a geologically quiescent region called the forearc wedge.

“We don’t have a good explanation for why that’s the case,” said Steve Hansen, a geoscientist at the University of New Mexico in Albuquerque.


Image: US Geological Survey

Seeking answers, Hansen recently led a seismic mapping survey of Mount St. Helens. In the summer of 2014, his team deployed thousands of sensors to measure motion in the ground around the volcano. Then, they drilled nearly two dozen holes, packed the holes full of explosives, triggered a handful of minor quakes, and watched as seismic waves bounced around beneath the mountain. “We’re looking at what seismic energy propagates off in the subsurface,” Hansen explained. “It’s a bit like a CAT scan.”

Their analysis, which is published today in Nature Communications, appears to have created more questions than it answered. From seismic reflections, Hansen and his colleagues learned that the types of minerals present at the boundary between Earth’s crust and mantle are markedly different to the east and west of Mount St. Helens, confirming that this area is geologically special. But instead of finding a hot mantle directly beneath the volcano, seismic data indicates a relatively cool wedge of serpentine rock.

Not only is Mount St. Helens out of place, but it also lacks the magma reserves we’d expect given its violent history. So, where on Earth is Mount St. Helens getting its fuel?

Hansen suspects the volcano’s magma source lies to the east, closer to the rest of the Cascade Arc, where material in the upper mantle is hotter. But that still leaves the question of why gooey rock being forced westward, through the crust or upper mantle, to erupt in this one off-kilter location. Earthquakes in the deep crust may be partially responsible, but more data is needed to confirm such a link.

Fortunately, more data is exactly what Hansen, and other scientists associated with the Imaging Magma Under St Helens (iMUSH) project, are now collecting. What geologists learn about this weird volcano—how its magmas form, how they move around, when and why they erupt—could improve our understanding of volcanic arc systems around the world.

“Mount St. Helens is pretty unusual,” Hansen said. “It’s telling us something about how the arc system is behaving, and we don’t yet know what that something is.”
Posted by Paul VanZant at 5:32 AM No comments:
Email ThisBlogThis!Share to XShare to FacebookShare to Pinterest

Monday, November 21, 2016

What Your Favorite Map Projection Says About You


Posted by Paul VanZant at 4:04 PM No comments:
Email ThisBlogThis!Share to XShare to FacebookShare to Pinterest

Sunday, November 20, 2016

15+ Stunning Satellite Photos That Will Change How You See Our World

Greta J.
Boredpanda

Photographer Benjamin Grant has set off on a mission to change the way we see our planet with his stunning photo project - Daily Overview.

Every single day, Grant shares one satellite photo from Digital Globes to change the way we see our planet. "With a focal length 16 times longer than a standard DSLR camera, the cameras are so powerful that you can take a picture of a beach ball on the Golden Gate Bridge in full resolution…from Los Angeles," Grant told Bored Panda. "I try to present the images with no bias and let people decide what these altered landscapes mean, based on the facts and the visual evidence in the frame. I believe that this perspective is a means to start a conversation about the condition of our planet and how we can better protect it."

"I create the images by stitching together numerous high-resolution satellite photographs. I partnered with a satellite company called DigitalGlobe and accordingly have access to their full archive of imagery. Once I have put together a composite image, I then treat it like a photograph to make it as crisp and easy to understand as possible to accentuate certain patterns, colors, or places." The results are so amazing, Grant has even put together a book of over 200 high-resolution satellite photographs. It's titled "Overview: A New Perspective of Earth", and can be purchased through Amazon.

#1 Palmanova, Italy

45.904892400°, 13.317671100°. Here’s one of my favorite images from the 'Where We Design' chapter in “Overview”. The town of Palmanova, Italy is recognized by its concentric layout known as a star fort. The rationale for this construction was that an attack on any individual wall could be defended from the two adjacent star points by shooting the enemy from behind. The three rings that surround Palmanova were completed in 1593, 1690, and 1813.


#2 Beach Pool, Mona Vale, NSW, Australia

-33.6787655, 151.3160979. Check out this incredible shot of the ocean pool at Mona Vale Beach, located in the suburbs of Sydney, Australia. There are a number of public ocean pools in New South Wales, offering stunning areas to swim, situated on the rocky coast, with waves splashing into the pool.


#3 Valparaíso, Chile

“Overview” — Valparaíso, Chile is built upon dozens of steep hillsides overlooking the Pacific Ocean. Known as “The Jewel of the Pacific,” the city is the sixth largest in the county and is home to approximately 285,000 residents. To learn more about the book, click here:


#4 Bourtange, Vlagtwedde, Netherlands

53.0066°N 7.1920°E. Bourtange is a village with a population of 430 in the municipality of Vlagtwedde in the Netherlands. The star fort was built in 1593 during the Eighty Years’ War when William I of Orange wanted to control the only road between Germany and the city of Groningen. Bourtange was restored to its mid-18th-century state in 1960 and is currently used as an open-air museum.


#5 Boca Raton, Florida

26.386332°, – 80.179917°. Residential development is seen in Boca Raton, Florida, USA. Because many cities in the state contain master-planned communities, often built on top of waterways in the latter half of the twentieth century, there are a number of intricate designs that are visible from the Overview perspective. Boca Raton is home to roughly 91,000 residents.


#6 Bahamas

Stunning blue waters surround and pass through the tidal channels of islands in the Bahamas. Small tidal changes on the banks cause water to flow through the narrow channels between the islands, first in one direction and then the other. The darker blue sections of water are the deepest parts of the channels and the surrounding light blue color is more shallow (less than 25 meters / 80 feet). This photo was captured from the International Space Station and is courtesy of NASA


#7 Seville, Spain

This solar concentrator in Seville, Spain use 2,650 heliostat mirrors to collect and focus the sun’s thermal energy to heat molten salt flowing through a 460-foot tall central tower. The molten salt then circulates from the tower to a storage tank where it is used to produce steam and generate electricity. In total, the facility displaces approximately 30,000 tons of CO2 emissions every year.


#8 Al Falah Housing Project, Abu Dhabi, United Arab Emirates

24.445187, 54.719998. The Al Falah Housing Project is located in Abu Dhabi, United Arab Emirates. The development covers 12.5 million square meters with 4,857 villas as well as mosques, schools, a shopping mall, and a hospital.


#9 Salt And Clay Pan, Namib Desert, Namibia

Salt and clay pan located on the edge of the Namib Desert in Namibia. These reddish sand dunes of the desert, seen in the top half of this Overview, are among the tallest in the world, with many rising more than 656 feet (200 meters).


#10 Pivot Irrigation Fields, Wadi As-Sirhan Basin, Saudi Arabia

30.089890096°, 38.271806556°. Center pivot irrigation is used throughout the Wadi As-Sirhan Basin of Saudi Arabia. Water is mined from depths as great as one kilometer (~3,000 ft), pumped to the surface, and evenly distributed by sprinklers that rotate 360 degrees. Spurred by a government effort to strengthen its agriculture sector, cultivated land in Saudi Arabia grew from 400,000 acres in 1976 to more than 8 million acres by 1993. For a sense of scale, the total area shown in this Overview is approximately forty square miles (32,000 acres).


#11 Rice Terraces, Yuanyang County, China

23°09′32″N 102°44′41″E. Rice paddies, constructed in steps, cover the mountainsides of Yuanyang County, China. Cultivated by the Hani people for the last 1300 years, the slope of the terraces varies from 15 to 75 degrees with some having as many as 3,000 steps. As we’ve been getting a lot of questions recently about prints, I want to mention that this Overview, and many others, can be purchased directly from our website in the Printshop section!


#12 Fruit Orchards, Huelva, Spain

37.714546°, -6.532834°. Fruit trees swirl on the hills of Huelva, Spain. The climate here is ideal for this growth with an average temperature of 17.8° C (64° F) and a relative humidity between 60% and 80%.


#13 Los Caracoles Pass, Andes Mountains

32°51'6"S 70°8'16"W. Los Caracoles Pass, or The Snails Pass, is a twisting mountain road located in a remote section of the Andes Mountains on the Chilean side of the border with Argentina. The path climbs to an elevation of 10,419 feet, has no roadside safety barriers, and is frequented by large trucks.


#14 Bahá'í House Of Worship, Wilmette, Illinois

42°4′27″N 87°41′3″W The Baha'i House of Worship in Wilmette, Illinois, is the oldest surviving Baha'i House of Worship in the world and the only one in the United States. The building contains an auditorium that seats 1,191 people beneath a 138 foot-high (42 m) domed structure. You’ll also notice that many components of the complex come in sets of nine as the number symbolizes perfection and completion in the Baha'i faith.


#15 Brøndby Haveby, Brønby Municipality, Denmark

55 ° 38 ’12.836031 “N, 12 ° 23′ 58.386726″ E


Posted by Paul VanZant at 5:03 PM No comments:
Email ThisBlogThis!Share to XShare to FacebookShare to Pinterest

Thursday, November 3, 2016

How Amnesty International Is Turning Supporters Into 'Decoders' To Track Human Rights Violations

Forbes
Federico Guerrini, Contributor
Oct 21, 2016

There’s almost no journalist, no human rights investigator left to document what’s happening in Sudan’s Darfur region. Restrictions imposed by the government have made access to the area impossible.

Activists struggle to provide evidence of the bombing and violent attacks with chemical weapons that they believe are being perpetrated on civilians by the Sudanese army forces and its allied militias.

Still, Amnesty International believes it has found a way to circumvent the limitations.


Image Credits: Amnesty International


Using a a crowdsourcing tool called the Decode Darfour Interactive Platform the organization is turning supporters into “decoders” who analyze vast amounts of satellite imagery looking for patterns of devastation.

The project is split into two phases: during the first, which lasts six weeks, participants will be shown small parcels of publicly available satellite images, dating back to some time ago, and they will be asked to identify signs of human presence, like villages, huts and metal roofs.

In a second phase, they will be tasked with comparing these old photos with more recent ones, identifying signs of violence and destruction. An empty spot where previously buildings could be seen. A burnt field. Destroyed structures.

“Analyzing this data is a long and laborious task. That’s why we are harnessing the power of our huge network of supporters to help,” Milena Marin, Amnesty International’s Senior Innovations Campaigner, said.

There’s clearly the chance of having ‘false positives’ or oversights; that’s why each image will be shown to a number of different decoders. The NGO’s researchers will also perform random checks on the data to ensure its quality.

In less than ten days since inception, according to data provided by the organization, 16,300 volunteers from 133 countries “decoded” 150,000 kilometers, roughly the area covered by Hungary and Croatia combined.

Decode Darfur is the second project for the Amnesty Decoders – a global network of digital volunteers for human rights research. The first one was focused on assessing the outcomes of Amnesty’s actions around the world.

Thousands of volunteers tried to identify the key trends emerging from the NGO’s massive trove of data. They found out that the actions against death penalty, discrimination and detention were the most successful, especially in the Middle East, Europe and Africa.

“This is an ambitious, revolutionary project that marks a fundamental shift in the way we view human rights research – and gives anyone with Internet access the chance to help expose some of the world’s gravest injustices,” said Marin of the Decode Darfur project.

Certainly, it’s a brilliant application of new technologies to a pressing human rights issue. Although whether such an analysis can provide data good enough to bear scrutiny, and be used as evidence in courts, remains to be seen
Posted by Paul VanZant at 4:53 AM No comments:
Email ThisBlogThis!Share to XShare to FacebookShare to Pinterest

Tuesday, November 1, 2016

People set foot on new island formed by huge undersea volcanic eruption

What was once a tiny dot in the middle of the Pacific Ocean has grown to 12 times its original size.
David Sim
October 27, 2016
IBT

For the first time, Japanese researchers have landed on a new island that sprung up in the Pacific Ocean during a volcanic eruption, swallowing its neighbouring island. What was once a tiny dot in the middle of the Pacific Ocean has grown to 12 times its original size.

Nishinoshima was a rocky outcrop barely 650 metres (710 yards) long and 200 metres (240 yards) wide. It was enlarged in 1974 when a set of eruptions created a new section, but then came the big one: In November 2013, a nearby seafloor volcano erupted, spewing enough material to rise above the waterline and forming a new island just 500 metres from Nishinoshima. Four months later, the new and the old islands had merged, becoming one island.

Aerial photograph of Nishinoshima in 1978National Land Image Information Color Aerial Photographs, Ministry of Land, Infrastructure, Transport and Tourism

20 November 2013: An erupting undersea volcano starts to form a new island off the coast of Nishinoshima Japan Coast Guard

20 November 2013: Material from the undersea eruption has begun to form a tiny island off the coast of Nishinoshima Japan Coast Guard

21 November 2013: An erupting undersea volcano starts to form a new island in the southern Ogasawara chain of islands Kyodo/Reuters

The new island is pictured merging with the old island on 24 December 2013 Japan Coast Guard

The new island dwarfs the old island, as seen on 26 December 2013Japan Coast Guard

15 April 2014: There is no longer any distinction between the two islands Japan Coast Guard

17 September 2014: Volcanic activity continues on the enlarged island Japan Coast Guard

Researchers from Japan's environment ministry, who swam the final distance from a small boat to the island to minimise biological contamination, were the first people to step foot on the island in recent history. Researchers landing on the island collected rock, plant and insect samples for ecological research. They also observed the first colonisation of the island by masked gannets, a large seafaring bird.

One of their main goals, the head of the research party said, was to learn how volcanic islands are created. "We hope to gather those different lava samples, and accumulated volcanic ash, to study the process of growth of a volcanic island," said Minoru Takeo, professor of volcanology at Tokyo University. Researchers also planted several seismic monitors around the uninhabited island to record
 future geological activity.

 An aerial view of the Pacific island of Nishinoshima on 20 October 2016Kyodo/Reuters

The crater and cinder cone are seen on 18 October 2016 Japan Coast Guard

Japanese researchers conduct surveillance activities for the first time since its eruption in 2013 Kyodo/Reuters

Nishinoshima, also called Rosario or Niijima, is located nearly 1,000 kilometres south of Tokyo and is part of the Ogasawara archipelago. The island is so remote it takes nearly a day by boat to get there from Ogasawara, the closest inhabited island. Studying volcanoes is high priority in Japan which lies on the "Ring of Fire", a horseshoe-shaped band of fault lines and volcanoes around the edges of the Pacific Ocean that is home to more than 100 active volcanoes.
Posted by Paul VanZant at 4:44 PM No comments:
Email ThisBlogThis!Share to XShare to FacebookShare to Pinterest
Newer Posts Older Posts Home
Subscribe to: Posts (Atom)

About Me

My photo
Paul VanZant
View my complete profile

Contact vangeog

Name

Email *

Message *

Blog Archive

  • ►  2017 (42)
    • ►  November (2)
    • ►  September (1)
    • ►  August (1)
    • ►  July (5)
    • ►  June (4)
    • ►  May (2)
    • ►  April (9)
    • ►  March (2)
    • ►  February (6)
    • ►  January (10)
  • ▼  2016 (123)
    • ►  December (14)
    • ▼  November (9)
      • The Journey That Reveals the Scope of Earth's History
      • This bizarre world map is actually crazily accurate
      • These Beautiful Maps Reveal the Secret Lives of An...
      • Watch Artisans Craft Old-Fashioned Globes By Hand
      • The Deadliest Volcano in the United States Just Go...
      • What Your Favorite Map Projection Says About You
      • 15+ Stunning Satellite Photos That Will Change How...
      • How Amnesty International Is Turning Supporters In...
      • People set foot on new island formed by huge under...
    • ►  October (16)
    • ►  September (10)
    • ►  July (2)
    • ►  June (4)
    • ►  May (11)
    • ►  April (13)
    • ►  March (19)
    • ►  February (8)
    • ►  January (17)
  • ►  2015 (40)
    • ►  December (15)
    • ►  November (12)
    • ►  October (4)
    • ►  March (4)
    • ►  February (5)
  • ►  2014 (34)
    • ►  June (3)
    • ►  May (3)
    • ►  April (8)
    • ►  March (3)
    • ►  February (9)
    • ►  January (8)
  • ►  2013 (81)
    • ►  December (5)
    • ►  November (14)
    • ►  October (11)
    • ►  September (16)
    • ►  August (5)
    • ►  July (9)
    • ►  June (11)
    • ►  May (6)
    • ►  April (4)

Geography Links

  • Ontario Association for Geographic and Environmental Education
  • National Geographic Society
  • Royal Geographical Society
  • Royal Canadian Geographical Society
  • This is Geography


New! Geography in Action

New! Geography in Action
Watermark theme. Powered by Blogger.