
Yasmin Tayag
November 1, 2017
Nestled between the Arctic and Atlantic oceans is Greenland, a slab of ice and rock that has caused more controversy than one might expect from the least densely populated country in thew world. For a long time, the Mercator map misrepresented Greenland as a giant land mass almost as big as Africa, but a 1970s reassessment cut it down to size, showing that it’s actually only about one-fourteenth of the continent’s area.
Now, in a cruel coincidence, new NASA maps show that Greenland is actually — physically — shrinking, and it’s happening at a much quicker pace than scientists once thought.
On Wednesday, in the journal Geophysical Research Letters, a team of NASA scientists together with collaborators from over 30 institutions published the most accurate high-resolution maps of Greenland’s bedrock and coastal seafloor, using data from NASA’s OMG campaign — short for Ocean Melting Greenland, but apt for describing its scary findings. The maps revealed some terrible news for the country’s 54,100 inhabitants: While scientists had long known that some of the glaciers comprising the icy landmass were melting because of climate change, it now appears that up to four times the original number of glaciers are under threat.
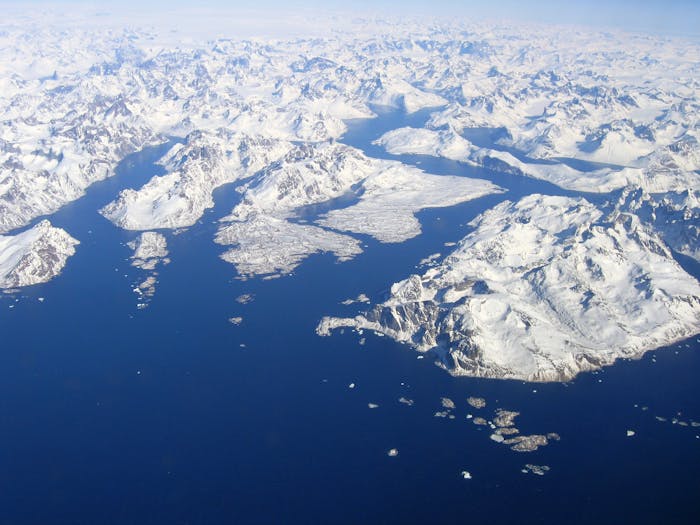
 Greenland's coasts are lined with glaciers, some of which extend into the warmer waters deep in the ocean.
“These results suggest that Greenland’s ice is more threatened by changing climate than we had anticipated,” said Jet Propulsion Laboratory scientist Josh Willis, who wasn’t involved in making the maps, in a statement from NASA.
Greenland is considered the world’s largest island, and about 80 percent of it is covered with a permanent ice sheet. Along its “long, convoluted coastline,” as NASA describes it, are free-floating glaciers, which are the most vulnerable to climate change. Previous estimates showed that, if all of Greenland’s ice were to melt, it would add 21.58 feet to global sea rise.
 On the left, dark blue regions show land that extends 4,900 feet below sea level. On the right, the darkest red regions show the parts of the land that are connected to the ocean, and the white line shows how far the ice sheet extends.
The new maps suggest that the effects of climate change on Greenland will be seen much sooner than expected. It’s hard to estimate the rate of glacier melt without knowledge of how they move and how deep the glaciers extend underwater, but the OMG data revealed what was going on beneath the water’s surface. It showed that two to four times as many glaciers actually extend deeper than 600 feet below sea level than scientists previously thought.
If all of Greenland's ice melts, it could lead to a sea level rise of 24.34 feet.
It may seem intuitive that the water gets colder as you go deeper into the ocean around Greenland, but the opposite is true. The surface water is actually colder, because it flows down from the Arctic ocean; beneath that is water that’s about 6 to 8 degrees Fahrenheit warmer, which flows from more temperature southern waters. The discovery that there are more glaciers that dip into these warm waters than previously expected is terrible news for Greenlanders, whose country is literally shrinking, and for the rest of us, who’ll actually have to deal with 24.34feet of sea level rise, according to the new estimates.
At current rates of climate change, the scientists estimate it will take several centuries for all of Greenland’s ice to melt, giving future mapmakers one less landmass to worry about.Photos via NASA/JPL/UCI, UCI, Flickr / Stig Nygaard
No comments:
Post a Comment