Visitors

Wednesday, March 9, 2016

Nicaragua's Momotombo Volcano Is Glorious In False Color Satellite Imagery


Andrew Liptak
March 6, 2016


Nicaragua’s Momotombo volcano began erupting in last December, for the first time in a hundred years, throwing gas and ash into the air, and it looks spectacular in images taken from orbit.


The Advanced Spaceborne Thermal Emission and Reflection Radiometer(ASTER) recently passed overhead and took an incredible picture of the volcano:


This false-color image shows off the extent of the plume and new lava flows that have erupted out of the volcano.

The image is false color—a combination of near-infrared, red, and green light (ASTER bands 3-2-1). Vegetation appears red; the volcanic plume is blue-gray; and lava flows are dark gray and brown.

The volcano is part of a much larger active chain that has erupted frequently in the last century, and due to the active field in the area, a geothermal plant is located near the volcano.
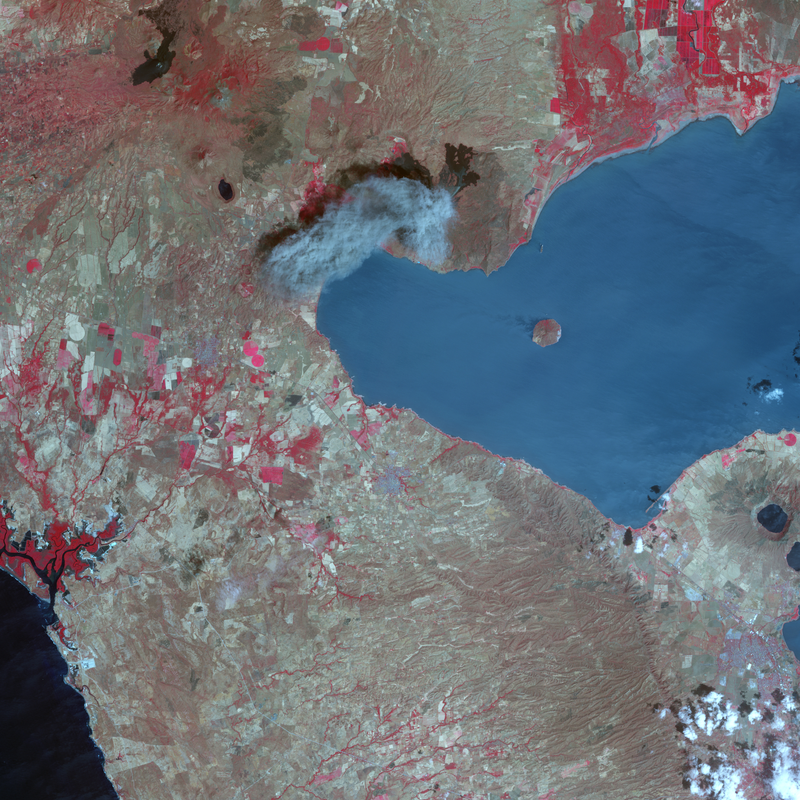
Image credit: CC BY-SA 3.0

Monotombo is an iconic Stratovolcano in Nicaragua, and is located near León, the country’s second-largest city. Notable eruptions in the past have forced evacuations: the city had to be moved 30 miles away in 1610 following a major eruption, and its remains, León Viejo, is now a World Heritage Site.

[Earth Observatory]

Tuesday, March 8, 2016

Students as Explorers: Using Google Earth With Literature

Jerome Burg
March 3, 2016 12:43 PM


Global education has the ability to engage students by helping them see the real-world connections and applications of what they are learning in the classroom. Today, Jerome Burg, founder and president of GLT Global ED and Google Lit Trips, explains how Google Earth is a great tool to bring literature to life.

The flexibility of digital mapping introduces unprecedented interactivity that is rapidly disrupting the usage of traditional static printed maps. With a single digital map we can now choose a global view, a regional view, or a street view. We can personalize our relationship to, and understanding of, the world within which we exist. We can become explorers, cartographers, creators, disseminators, and consumers of immersive interactive global geo-spatial information.

The Google Lit Trips project was born from curiosity: could Google Earth be conducive to creating an immersive interactive experience that could enhance student engagement by adding real world relevance to fiction and narrative nonfiction? Would it be possible to virtually allow students inside the story to interact with stories set in the real world, where readers become virtual traveling companions of the characters? If so, this might enhance the reader's intellectual and emotional understanding of the human condition as experienced by the characters as well as their own understanding of it.

Setting the Virtual Stage

Google Earth, through the power of suspension of disbelief, allows students to virtually feel as though they are inside, and interacting with, the story. For example, by tilting and reorienting the view away from the traditional bird's eye view to one more like a first person perspective, the reader can virtually see the world from the character's point of view.


Traditional mapping view of road to Jalalabad with Bird's Eye view and North at the top.


Virtual view of road to Jalalabad with tilted view and reoriented direction of travel is at the top.

The images above show a very different view of the area of road from Kabul to Jalalabad through which Amir and Baba traveled in Khaled Hosseini's The Kite Runner. The image on the top, though bringing the wonders of satellite technology into play, in reality does little to create an immersive engagement. There is neither a sense of the look and feel of the land nor even of the direction of travel. Thus viewers are unnaturally distanced from the experience the characters are having.

But the image of the same location on the bottom, when tilted and reoriented, adds a 3D dimension to the traveling experience. Readers find themselves virtually looking through the windshield seeing the terrain as the road ahead winds through the treacherous Khyber Pass in the distance and the unknown beyond.

Among Google Earth's additional resources to set the stage for a "journey," is the ability to zoom out to reveal more geo-context similar to a long shot used in films or to zoom in as close as a photographic street view, to emphasize detail similar to a close up shot used in film. Google Earth's animation of the movement from place to place mirrors the sensation of actually traveling alongside the characters.

The effect can be similar to the willing suspension of disbelief experienced when readers are thoroughly engaged in a story. Even though they know they are not, readers temporarily allow themselves to feel as though they are in the same place, at the same time, facing the same challenging circumstances as the characters. The likelihood that readers will more readily experience empathy for their traveling companions' circumstances increases.

However, the primary benefit in "virtualizing" story locations, aside from the obvious benefit of blending relevant geography curriculum goals with those of literary reading, is a plot-level engagement. Essentially, it immerses student attention in connecting place to plot.

Placemarks, Popups, and Pedagogy
The challenge then becomes, to what extent is it feasible to virtualize student engagement with the story's themes, making it possible to create a learning experience where students feel as though they are explorers discovering the story's relevance in their own lives.

To this end, we turn to the power of placemarks. In Google Earth the traditional static yellow pushpin place markers become dynamic content-rich, "just-in-time" exploration opportunities.

It is the placemark popup windows that carry the pedagogical focus of a Lit Trip. Placemark content can take advantage of journey literature's unique blend of fact and fiction by intentionally exposing characters to real-world history, traditions, and cultures beyond the world they had known. Similarly well-designed popup window content can personalize student engagement with a story's themes, engaging readers in learning that expands their global awareness via seamless blends of literary and informational readings, and with cross-curricular and cross-cultural virtual encounters of their existing and newly discovered understandings of the human condition.

Our goal is to create immersive placemark popup content that offers intrinsic motivations to stop and linger as students are invited to explore within, as well as beyond, the story's themes, discovering for themselves the intrinsic rewards to be found by venturing into their personal zones of proximal development.

Higher-level discussion starters replace plot-level questions, which too often redirect student attention toward only wondering what will be on the quiz, with interesting opportunities for students to connect their personal introspection and reflections upon a story's themes.

Text, media, and internet links can be brought together in Google Earth placemark popup windows to extend the virtualization experience well beyond virtualizing the locations alone.


The first location placemark in "Abuela," by Arthur Dorros.
In the children's book, Abuela, by Arthur Dorros, Rosalba, who grew up in New York City, shares that her abuela (grandmother) immigrated to New York City after having grown up in Puerto Rico. For this reason, the first placemark view is set to a long shot so that students can see the geographical relationship between Puerto Rico and New York City. The story mirrors elements of the multi-generational and multi-cultural immigration experience common to people of many cultures.

Students can watch a video about the annual Puerto Rico Day parade where they see people of Puerto Rican heritage and of many other cultures celebrating the music, dress, and customs of Puerto Rico. Students are also invited to explore the Time for Kids Around the World Puerto Ricosite for information about Puerto Rico where they can explore some of the similarities and differences between Puerto Rican culture and their own.

In another placemark students are encouraged to identify common words that are actually Spanish words and to guess the meanings of a few Spanish words they may not know. In that placemark they find links to this Spanish for Kids site. Another appropriately focuses upon the Statue of Liberty and includes a 360° aerial tour of the statue.

In Google Lit Trips, the traditional, single-subject curricular focus becomes a virtualized cross-curricular and cross-cultural immersive multimedia experience connecting students' personal lives to the lives of characters from our shared global literary heritage. In short, Google Lit Trips provides a venue in which students can explore and discover for themselves the answer to that old question: "What in the world does this story have to do with anything I care about?"

Related Resources

RSA ANIMATE: Drive: The Surprising Truth about What Motivates Us. The RSA.YouTube. Adapted from Dan Pink's talk at the RSA, illustrates the hidden truths behind what really motivates us at home and in the workplace.
Christensen, Clayton M., Michael B. Horn, and Curtis W. Johnson. Disrupting Class: How Disruptive Innovation Will Change the Way the World Learns. McGraw-Hill, 2011. Print.
GLT Overview: Animation Demo. GoogleLitTrips. Vimeo Video. Video uses a single placemark from the Google Lit Trip for The Kite Runner to demonstrate the look, feel, and basic design of Lit Trip popup windows.

Follow Jerome and Heather on Twitter.

Images courtesy of the author.

Monday, March 7, 2016

Greenland's ice is getting darker, increasing risk of melting

Feedback loops from melting itself are driving changes in reflectivity

Date: March 3, 2016
Source: The Earth Institute at Columbia University
Summary: Greenland's snowy surface has been getting darker over the past two decades, absorbing more heat from the sun and increasing snow melt, a new study of satellite data shows. That trend is likely to continue, with the surface's reflectivity, or albedo, decreasing by as much as 10 percent by the end of the century, the study says.Share:


An aerial image of Greenland shows rivers of meltwater and areas of dark ice. Greenland's surface is absorbing more solar radiation as melting increases grain size and brings old impurities to the surface.
Credit: Marco Tedesco/Lamont-Doherty Earth Observatory

Greenland's snowy surface has been getting darker over the past two decades, absorbing more heat from the sun and increasing snow melt, a new study of satellite data shows. That trend is likely to continue, with the surface's reflectivity, or albedo, decreasing by as much as 10 percent by the end of the century, the study says.

While soot blowing in from wildfires contributes to the problem, it hasn't been driving the change, the study finds. The real culprits are two feedback loops created by the melting itself. One of those processes isn't visible to the human eye, but it is having a profound effect.

The results, published in the European Geosciences Union journal The Cryosphere, have global implications. Fresh meltwater pouring into the ocean from Greenland raises sea level and could affect ocean ecology and circulation.

"You don't necessarily have to have a 'dirtier' snowpack to make it dark," said lead author Marco Tedesco, a research professor at Columbia University's Lamont-Doherty Earth Observatory and adjunct scientist at NASA Goddard Institute of Space Studies. "A snowpack that might look 'clean' to our eyes can be more effective in absorbing solar radiation than a dirty one. Overall, what matters, it is the total amount of solar energy that the surface absorbs. This is the real driver of melting."

The feedback loops work like this: During a warm summer with clear skies and lots of solar radiation pouring in, the surface starts to melt. As the top layers of fresh snow disappear, old impurities, like dust from erosion or soot that blew in years before, begin to appear, darkening the surface. A warm summer can remove enough snow to allow several years of impurities to concentrate at the surface as surrounding snow layers disappear. At the same time, as the snow melts and refreezes, the grains of snow get larger. This is because the meltwater acts like glue, sticking grains together when the surface refreezes. The larger grains create a less reflective surface that allows more solar radiation to be absorbed. The impact of grain size on albedo -- the ratio between reflected and incoming solar radiation -- is strong in the infrared range, where humans can't see, but satellite instruments can detect the change.

"It's a complex system of interaction between the atmosphere and the ice sheet surface. Rising temperatures are promoting more melting, and that melting is reducing albedo, which in turn is increasing melting," Tedesco said. "How this accumulates over decades is going to be important, because it can accelerate the amount of water Greenland loses. Even if we don't have a lot of melting because of atmospheric conditions one year, the surface is more sensitive to any kind of input the sun can give it, because of the previous cycle."

The study used satellite data to compare summertime changes in Greenland's albedo from 1981 to 2012. The first decade showed little change, but starting around 1996, the data show that due to darkening, the ice began absorbing about 2 percent more solar radiation per decade. At the same time, summer near-surface temperatures in Greenland increased at a rate of about 0.74?C per decade, allowing more snow to melt and fuel the feedback loops.

A likely cause for the large shift around 1996 was a change in atmospheric circulation, Tedesco said. The North Atlantic Oscillation, a large-scale natural weather cycle, went into a phase in which summer atmospheric conditions favored more incoming solar radiation and warmer, moist air from the south. Later records show those conditions shifted in 2013-2014 to favor less melting, but the damage was already done -- the ice sheet had become more sensitive. In 2015, melting spiked again to reach more than half of the Greenland ice sheet.

While new snowfall can make the ice sheet brighter again, the dark material built up during the melt years is waiting just below the surface, preconditioning the surface to future melting, Tedesco said.

The scientists also ran a computer model to simulate the future of Greenland's surface temperature, grain size, exposed ice area and albedo. Over the current century, the model projects that the average albedo for the entire ice sheet will fall by as much as 8 percent, and by as much 10 percent on the western edge, where the ice is darkest today. Those are conservative estimates -- the change could be twice that, Tedesco said.

The scientists looked into the hypothesis that soot from forest fires in China, Siberia and North America could be driving the increased darkening of the ice sheet. Using the Global Fire Emissions Database, they analyzed trends in black-carbon emissions from wildfires in those regions and Europe. While the amount of black carbon released by fires varied year to year, the scientists found no statistically significant increase during 1997-2012 to match the darkening of Greenland.

The study also raises questions about whether Greenland's high plateau is darkening as previous reports have suggested. The scientists found no long-term trend of darkening at the top, and they suspect that the Terra MODIS satellite sensor that has detected darkening in the past may actually be degrading, as previous studies have suggested. At lower elevations, the signal is much stronger.

"It is a very good paper which provides valuable new insights about the physical processes controlling the change in reflectivity of the Greenland ice sheet and specifically its darkening over time," said Eric Rignot, a senior research scientist at NASA's Jet Propulsion Laboratory who studies ice sheets but was not involved with the new study. "I also find it particularly interesting that the darkening indicated earlier by satellite sensors is now confirmed to be less, which is good news for the ice sheet. Yet the darkening of Greenland around its periphery remains a source of concern because it contributes to making the ice sheet melt away faster."

The feedback loops could be stopped with lots of snowfall and less melting, but that doesn't seem likely given the increasing concentration of greenhouse gases in the atmosphere, Tedesco said. And while warming is expected to increase precipitation, that precipitation includes increasing rainfall, which speeds up melting. Melting is also moving to higher elevations as global temperatures warm.

"As warming continues, the feedback from declining albedo will add up," Tedesco said. "It's a train running downhill, and the hill is getting steeper."

Story Source:

The above post is reprinted from materials provided by The Earth Institute at Columbia University. Note: Materials may be edited for content and length.


Journal Reference:

Marco Tedesco, Sarah Doherty, Xavier Fettweis, Patrick Alexander, Jeyavinoth Jeyaratnam, Julienne Stroeve. The darkening of the Greenland ice sheet: trends, drivers, and projections 1981-2100).The Cryosphere, 2016; 10 (2): 477 DOI: 10.5194/tc-10-477-2016

Friday, March 4, 2016

GPS art creations put ‘Cycleangelo’ on the map

By: Ben Spurr Staff Reporter
Toronto Star
Wed Mar 02 2016


Stephen Lund has become a minor celebrity in the biking world after creating more than 85 incredible virtual “doodles’ by tracking his bike routes via GPS


GPS DOODLES / CATERS NEWS AGENCY

Stephen Lund's designs are so detailed - like this one of Darth Vader - that many people don't believe they're real. Lund says he wanted to create a special doodle for the unofficial Star Wars holiday of May the 4th, and eventually decided on the sith baddie. He completed the 46.3-km drawing with a member of his cycling club.

_______________________________________________________________________________


They call him Cycleangelo. His canvas is the streets of Victoria, B.C., and his artist’s tools are a bicycle and a pair of spandex-clad legs.

Stephen Lund, 50, has become a minor celebrity in the biking world after creating more than 85 incredible virtual “doodles” by tracking his specially designed bike routes via GPS, and uploading them to the Internet.

He started with a simple New Year’s message spelled out on the streets, but his designs quickly evolved into massive, amazingly complex critters and characters that take hours to plot out and even longer to cycle through.

Lund, a 50-year-old who works as a marketing consultant, is an avid amateur cyclist. He said he biked more than 22,300 kilometres last year, about a quarter of which he spent on his map art.


GPS DOODLES

Some of Lund's designs span more than 100 square kilometres and require meticulous planning, and his efforts have earned him the status of a minor celebrity in cycling circles.

He said he conceived of the doodles as “a way to inject a little bit of fun into my bike rides” after he bought a GPS tracking device and paired it with the Strava app a little over a year ago.

“It struck me almost immediately that this red line on the map had more to it than just tracking ... I decided to do some experimentation,” he said.

The pieces, some of which span an area greater than 100 square kilometres, require meticulous planning. He uses the satellite and Street View features on Google Maps to write himself directions so detailed that he knows to turn “at this fire hydrant three quarters of the way up the block.”

“It becomes quite precise,” he said.


GPS DOODLES / CATERS NEWS

It took Lund three bikes and 12 hours to create this intricate 89.6-km mermaid, titled "Mermaid of the Salish Sea." While many of his designs take hours to complete, this was by far the most difficult one he has undertaken so far.

Some of Lund’s pieces represent a single continuous ride. But if the roads don’t align with his design he uses what he calls the “connect-the-dots” method — he turns off his GPS device and restarts it again from another position, which creates a straight line on the map and allows him to craft more intricate details.

The process can involve many stops and starts, so he has to pay close attention to where he is. There are no erasers when you’re drawing with GPS. “Three hours, four hours into a ride you start to get tired. You stop focusing and you miss a turn, and it’s like, ‘Oh, my god.’ ”

On at least one occasion, Lund has had to abandon a project partway through when he realized he botched it.


GPS DOODLES / CATERS NEWS

Using just a bicycle and determination, Stephen Lund wove this giant anteater design through the streets of Victoria, B.C.

So far, he’s drawn sea serpents, kangaroos, Darth Vader and Yoda, and even written “Merry Christmas.” But he said his favourite work is probably Garmina the Giraffe, a 95.4-km doodle that he completed in February 2015 and was his first to go viral.

His most difficult was a mermaid, whose face and hair he rendered in astounding detail. He said it took about 12 hours to design, and once he hit the road to create it, he had to use three bikes because he damaged the first two. The 220-kilometre trip was also hampered by rain, and took him two days to finish.

“It was like the universe was conspiring against it,” he said. “I would have been just absolutely distraught had it not turned out. There was no way I could have gone out and repeated the whole thing.”


GPS DOODLES / CATERS NEWS

Lund says he created this 25-km kangaroo for his Australian followers, who had asked him to tackle a marsupial.

Lund’s doodles are so incredible that some people don’t believe they’re real. Internet commenters have accused him of being a fraud, he said, but he’s adamant the images are authentic. He said the proof is that he records and posts them through the Strava app. “You can’t outwit the GPS,” he said.

Although he has detractors, he said most people’s reactions have been overwhelmingly positive. He’s done spots on Canadian and American television, been featured in numerous cycling magazines, and last November was invited to speak at the TEDx conference in Victoria.

His masterpieces have now been seen by thousands of people all over the world, and as warm cycling weather returns to British Columbia, he plans to keep adding to his oeuvre. “The possibilities for it are really quite limitless,” he said.

Thursday, March 3, 2016

The Transformation of Geography

By Julie Cohen
Tuesday, March 1, 2016 - 11:30
Santa Barbara, CA

A good news story . . .

Michael Goodchild receives the Stanley Brunn Award for Creativity in Geography for his role in the creation of geographical information


Michael Goodchild


(Santa Barbara, Calif.) — Digital maps and map apps have become so ubiquitous — think CoPilot, GPS, MapQuest and Map Factory — that many of us would be lost without them. The technology we now take for granted can be credited, in large part, to the vision and creativity of geographers who imagined its potential.

Take UC Santa Barbara geographer Michael Goodchild, for example; he helped transform the discipline and move it into the 21st century. In recognition of his accomplishments, the American Association of Geographers has presented Goodchild with the Stanley Brunn Award for Creativity in Geography. The award celebrates work that has demonstrated originality, creativity and significant intellectual breakthroughs in the field.

“Computers make it so much easier to edit maps,” said Goodchild, a professor emeritus in UCSB’s Department of Geography. “Various tasks like map projections tend to be complex and mathematical, which makes them easy to deliver through a computer.

“A paper map is not terribly easy to analyze and something as simple as measuring the area of a city is actually quite a difficult task when performed by hand, but with a computer, it’s easy,” Goodchild continued. “For overlaying maps, instead of having to redraft a map as a transparency and then overlay it, you can overlay it digitally and then easily compute things like the areas of overlap.”

For more than 25 years, UCSB has been instrumental in building a science behind geographic information systems (GIS). In 1992, a seminal paper by Goodchild helped transform GIS software from technology to science. Later his innovative work pioneered crowdsourcing as a way of gathering geographic information in much the same way that the navigation app Waze uses community-based traffic reports to provide the best route.

“The concept is that ordinary citizens help supply information to make maps by collecting geographic information,” Goodchild said. “At the time, I coined the phrase ‘volunteered geographic information.’”

Goodchild was also instrumental in creating a digital map library. “The whole process of going online, searching for geographic information, examining it, retrieving it and using it — which has now become very common — was a project that I, along with my colleagues, initiated in the early 1990s,” he said.

“Throughout his career, Mike had substantial influence on the nature and accessibility of GIS technology,” said Dan Montello, chair of UCSB’s Department of Geography. “But he and his work were more important for the creative intellectual avenues they paved, the fascinating problems he imagined and communicated involving the nature and use of geographic information, and the appealing and understandable way he did what he did.”

- See more at: http://www.news.ucsb.edu/2016/016509/transformation-geography#sthash.DW7fxPih.dpuf

Wednesday, March 2, 2016

Fears of IMMINENT eruption of LARGEST active volcano on Earth


Source: Express.co.uk


Mauna Loa, located on the Island of Hawaii, is one of the biggest active volcanoes and in
recent years, the USGS (US Geological Survey) Hawaiian Volcano Observatory has detected
more frequent seismic activity in the region.

The volcano has not erupted since 1984 and is long overdue an eruption having blown 10 times
in the 20th century prior to this.

The US’s National Park Service writes: “When Mauna Loa erupts, voluminous, fast-moving
lava flows can reach the ocean in only a few hours, severing roads and utilities and repaving
the volcano’s flanks along the way.

“Since 1843, Mauna Loa has erupted 33 times, most recently in 1984, when lava flows reached
to within 4 miles (6.4 km) of Hilo.”

In September last year, the USGS Hawaiian Volcano Observatory upgraded the alert level
from “Normal” to “Advisory” due to the mini earthquakes that it has been experiencing.

Scientists at the USGS Hawaiian Volcano Observatory wrote in an article for Hawaii 24/7:
“As is often the case during volcanic unrest around the world, the current activity at Mauna Loa
has not followed a steady, predictable trend.

“Overall, earthquake rates remain above normal background levels.

“But, a closer look at the seismic record reveals that earthquakes have occurred at higher
rates for weeks to months, separated by quieter periods of a week or so.”

What makes the volcano more terrifying is that experts are unable to give a timeframe on
when Mauna Loa might erupt.

The scientists continue: “Unrest at Mauna Loa is not following a simple script. This is why,
at this point in time, it is not possible to forecast with certainty if or when the volcano will
erupt as a result of this unrest.”


Tuesday, March 1, 2016

Check Out This Tiny New Island Born of a Volcano

Author: Esther Inglis-Arkell
Source: Gizmodo
Date: Friday 8:00pm


The Ogasawara Islands, just south of Japan, are a beautiful and geologically active spot. In 2013, members of the Japan Maritime Self-Defense Force noticed a “hot spot” among the islands, near the Nishinoshima volcano. They had found a small, entirely new islet, just south of the main volcano.

The researchers describe their findings in the journal Geology. The island started as what’s known as a Surtseyan eruption—a relatively violent underwater eruption of molten basalt. Eventually it created a cone of cooled lava, which prevented water from rushing into the eruption site. It turned into a Strombolian eruption—a steady series of moderate, dry eruptions which build up rock over time.


The result is a small island that looks like a bit of exposed brain floating in the water, thanks to its weird, twisting lava flows. It’s this convoluted tubing that interests the geologists. They’ve been studying “the development of lobes and tubes from breakouts and bifurcations . . . that fed lava to the active flow front.” Instead of a straight flow from the mouth of the volcano and into the sea, the lava took twisted paths from the volcano to the front of the flow, where it would eventually cool and turn into stone.

Now who gets naming rights?